the table gives values for a polynomial function $g$ at selected values of $x$. if $a < b$, then $g(a)>g(b)$…
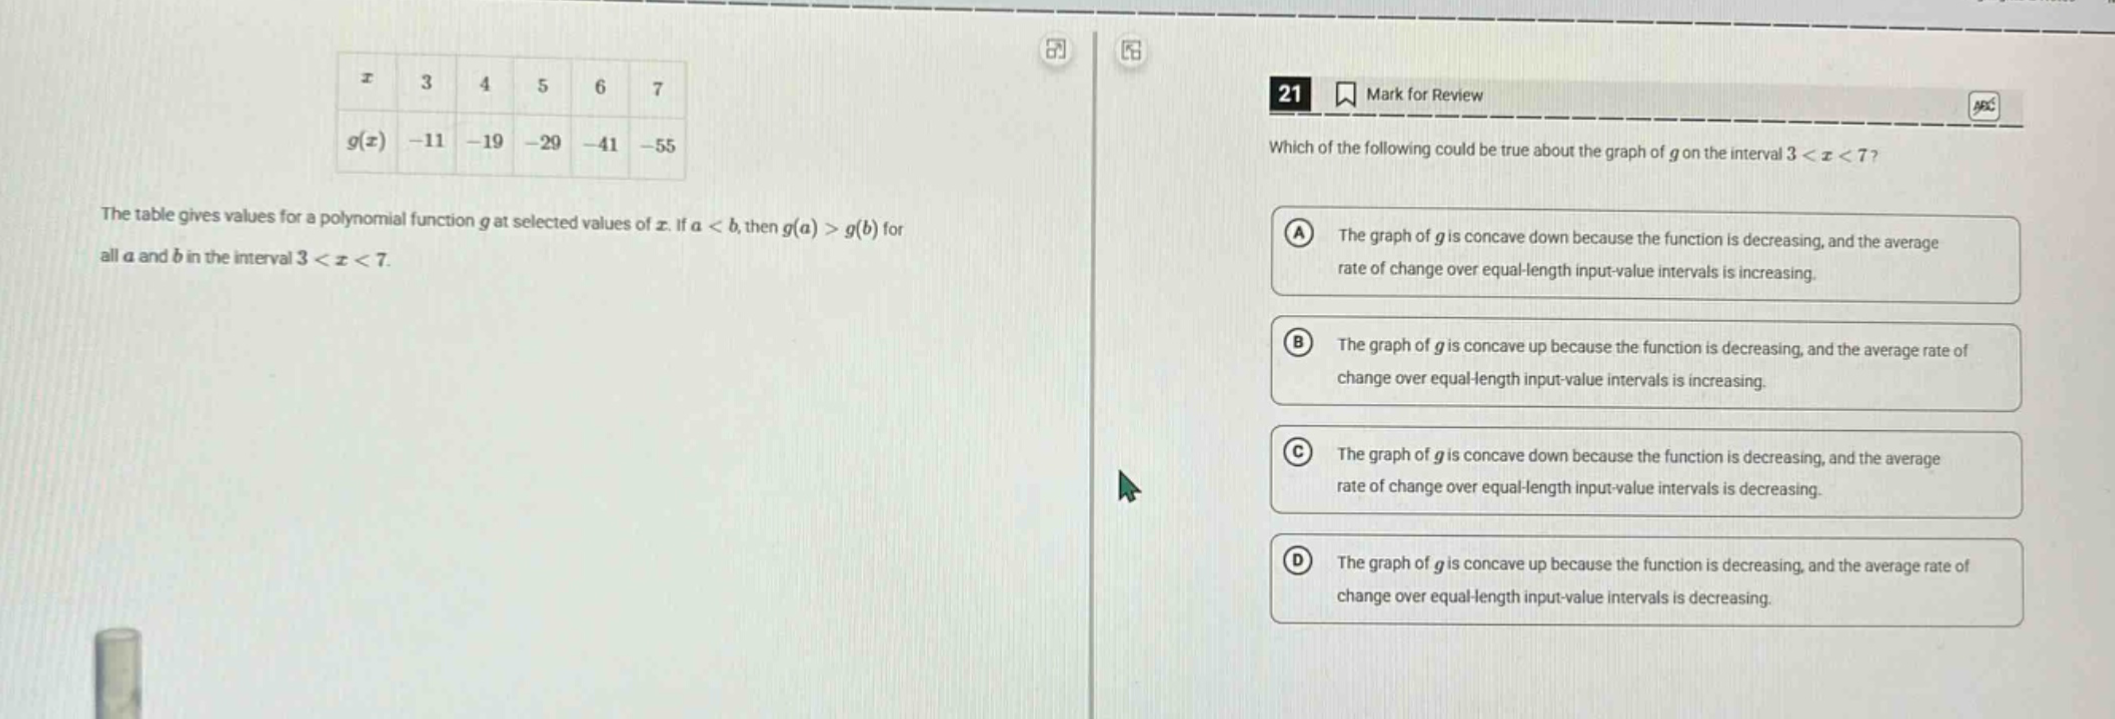
the table gives values for a polynomial function $g$ at selected values of $x$. if $a < b$, then $g(a)>g(b)$ for all $a$ and $b$ in the interval $3 < x < 7$.\n21 mark for review\nwhich of the following could be true about the graph of $g$ on the interval $3 < x < 7$?\na the graph of $g$ is concave down because the function is decreasing, and the average rate of change over equal - length input - value intervals is increasing.\nb the graph of $g$ is concave up because the function is decreasing, and the average rate of change over equal - length input - value intervals is increasing.\nc the graph of $g$ is concave down because the function is decreasing, and the average rate of change over equal - length input - value intervals is decreasing.\nd the graph of $g$ is concave up because the function is decreasing, and the average rate of change over equal - length input - value intervals is decreasing.
Answer
Explanation:
Step1: Calculate average rate of change
For the interval ([3,4]), average rate of change (=\frac{g(4)-g(3)}{4 - 3}=\frac{-19-(-11)}{1}=-8). For ([4,5]), average rate of change (=\frac{g(5)-g(4)}{5 - 4}=\frac{-29-(-19)}{1}=-10). For ([5,6]), average rate of change (=\frac{g(6)-g(5)}{6 - 5}=\frac{-41-(-29)}{1}=-12). For ([6,7]), average rate of change (=\frac{g(7)-g(6)}{7 - 6}=\frac{-55-(-41)}{1}=-14).
Step2: Analyze concavity
The function (g(x)) is decreasing since (g(a)>g(b)) when (a < b) in the interval (3<x<7). The average rate of change over equal - length input - value intervals ((\Delta x = 1) here) is decreasing ((-8>-10>-12>-14)). A function that is decreasing and has a decreasing average rate of change is concave down.
Answer:
C. The graph of (g) is concave down because the function is decreasing, and the average rate of change over equal - length input - value intervals is decreasing.