the table of values represents a continuous function.\n|$x$|$f(x)$|\n|----|----|\n|$-2$|$-6$|\n|$-1$|$6$|\n|$…
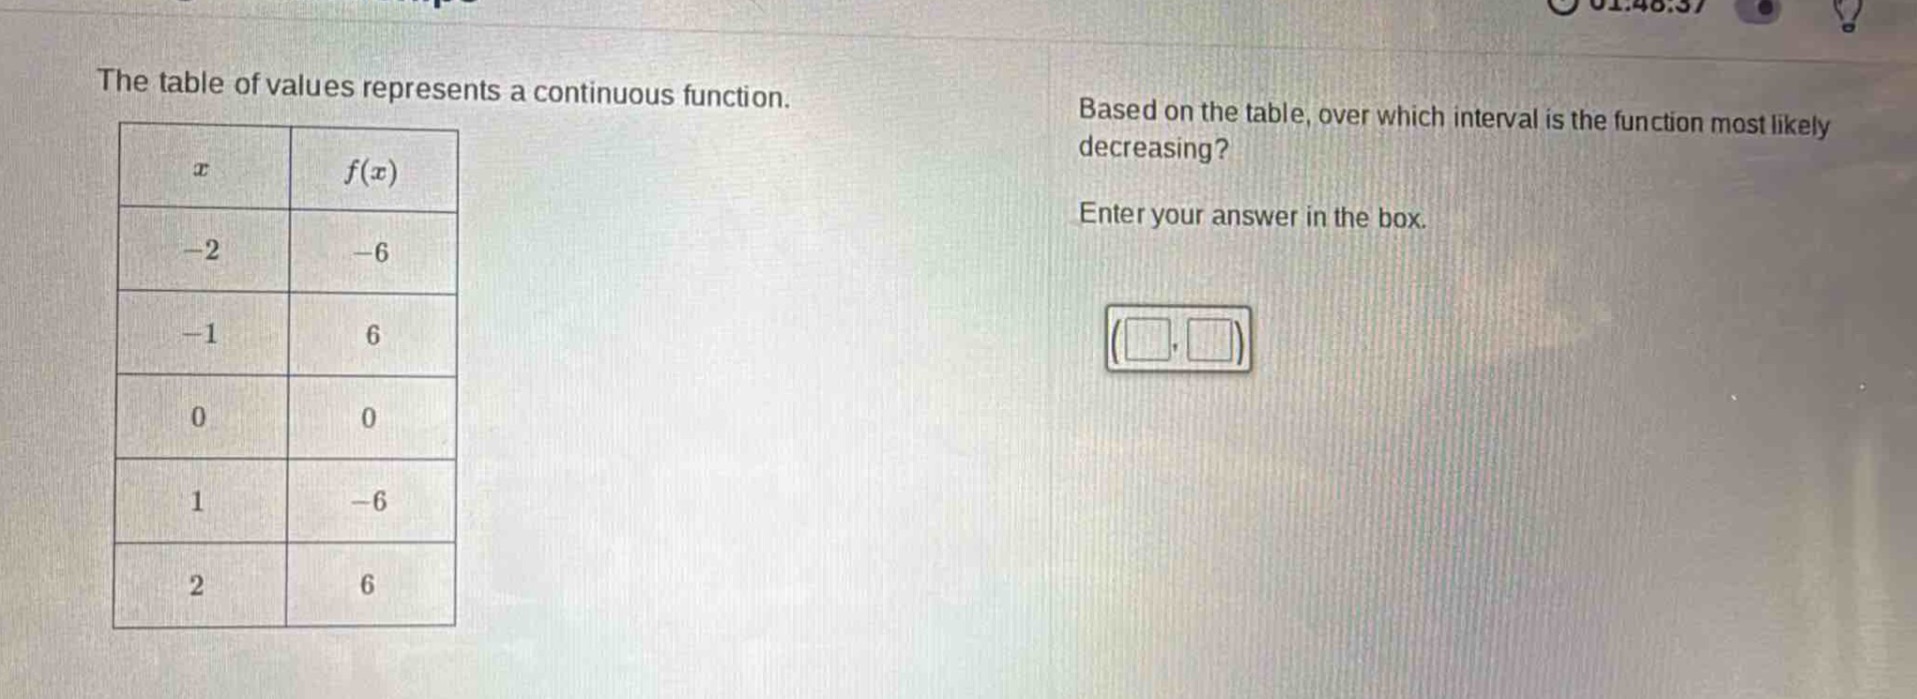
the table of values represents a continuous function.\n|$x$|$f(x)$|\n|----|----|\n|$-2$|$-6$|\n|$-1$|$6$|\n|$0$|$0$|\n|$1$|$-6$|\n|$2$|$6$|\nbased on the table, over which interval is the function most likely decreasing?\nenter your answer in the box.
Answer
Explanation:
Step1: Check function values for intervals
When (x) goes from (- 1) to (0), (f(-1)=6) and (f(0) = 0), function value decreases. When (x) goes from (0) to (1), (f(0)=0) and (f(1)=-6), function value also decreases.
Step2: Determine the decreasing - interval
The function is decreasing over the interval where as (x) increases, (f(x)) decreases. The interval ((0,1)) shows a decrease in the function values.
Answer:
((0,1))