tammy is driving at a constant speed. she then slows down to pass an accident. after passing it, she…
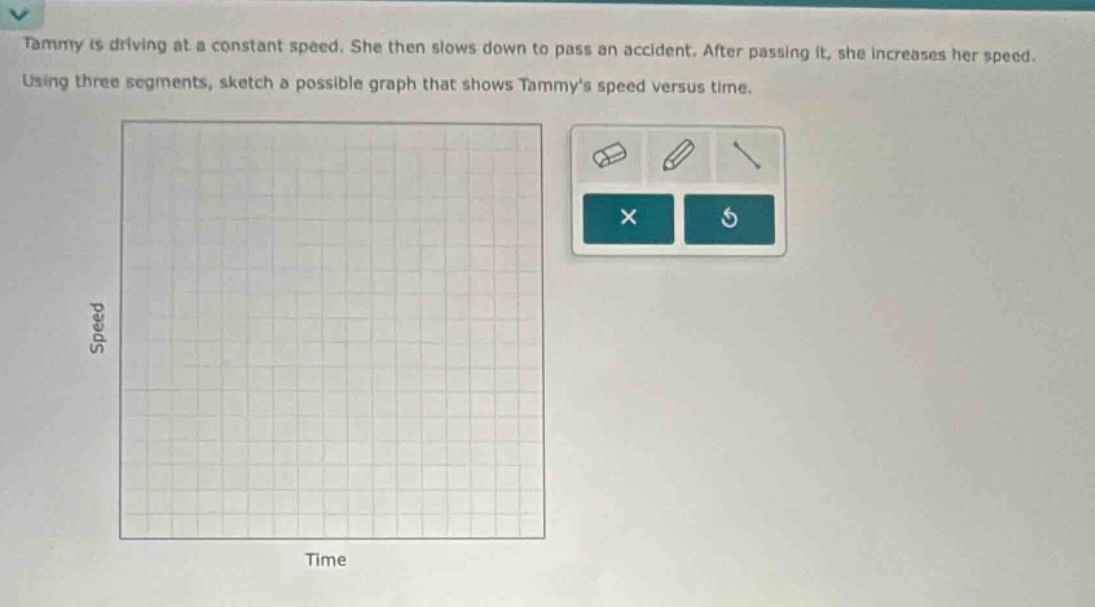
tammy is driving at a constant speed. she then slows down to pass an accident. after passing it, she increases her speed. using three segments, sketch a possible graph that shows tammys speed versus time.
Answer
Explanation:
Step 1: Constant Speed Segment
Horizontal line (slope = 0) representing initial speed.
Step 2: Slowing Down Segment
Line with negative slope (decreasing speed) after starting to pass.
Step 3: Increasing Speed Segment
Line with positive slope (increasing speed) after passing, returning to or above initial speed.
Answer:
The graph has three segments: a horizontal line for constant speed, a downward-sloping line for slowing down, and an upward-sloping line for increasing speed, with each segment connected sequentially over time.