3. technology required. a function f gives the number of stray cats in a town t years since the town started…
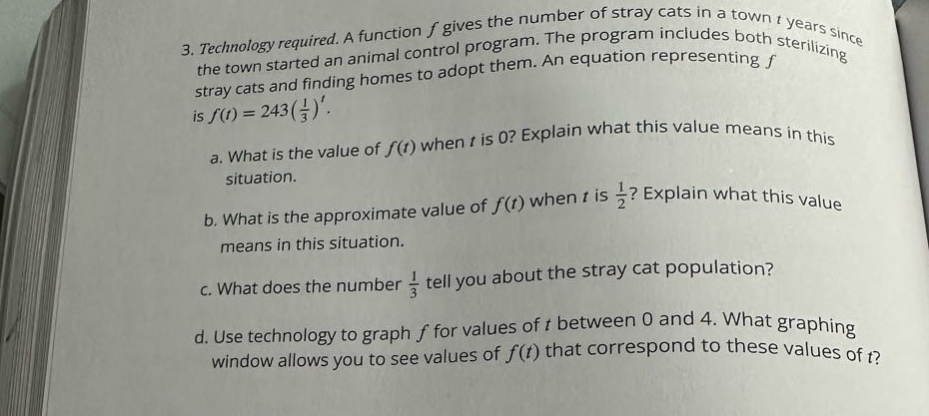
3. technology required. a function f gives the number of stray cats in a town t years since the town started an animal control program. the program includes both sterilizing stray cats and finding homes to adopt them. an equation representing f is f(t)=243(1/3)^t. a. what is the value of f(t) when t is 0? explain what this value means in this situation. b. what is the approximate value of f(t) when t is 1/2? explain what this value means in this situation. c. what does the number 1/3 tell you about the stray cat population? d. use technology to graph f for values of t between 0 and 4. what graphing window allows you to see values of f(t) that correspond to these values of t?
Answer
Explanation:
Step1: Evaluate f(t) at t = 0
Substitute t = 0 into $f(t)=243(\frac{1}{3})^t$. Since any non - zero number to the power of 0 is 1, $(\frac{1}{3})^0 = 1$. So $f(0)=243\times1 = 243$. This means that at the start (0 years since the animal control program began), there were 243 stray cats in the town.
Step2: Evaluate f(t) at t=$\frac{1}{2}$
Substitute t = $\frac{1}{2}$ into $f(t)=243(\frac{1}{3})^t$. We have $f(\frac{1}{2})=243(\frac{1}{3})^{\frac{1}{2}}$. Since $(\frac{1}{3})^{\frac{1}{2}}=\frac{1}{\sqrt{3}}$ and $243 = 3^5$, then $f(\frac{1}{2})=3^5\times\frac{1}{\sqrt{3}}=3^5\times3^{-\frac{1}{2}}=3^{5-\frac{1}{2}}=3^{\frac{9}{2}}=\sqrt{3^9}\approx137.5$. This means that half a year after the animal control program began, there were approximately 138 stray cats in the town.
Step3: Analyze the meaning of $\frac{1}{3}$
The number $\frac{1}{3}$ is the base of the exponential function. It represents the factor by which the stray - cat population is multiplied each year. So the stray - cat population is decreasing by a factor of $\frac{1}{3}$ each year.
Step4: Graphing window
For $t$ between 0 and 4, a good graphing window for the x - axis (t) is $[0,4]$ and for the y - axis ($f(t)$), since $f(0) = 243$ and $f(4)=243\times(\frac{1}{3})^4=243\times\frac{1}{81}=3$, a good window for the y - axis is $[0,250]$.
Answer:
a. $f(0)=243$. It means there were 243 stray cats at the start of the animal - control program. b. $f(\frac{1}{2})\approx138$. It means there were approximately 138 stray cats half a year after the program started. c. The stray - cat population is multiplied by $\frac{1}{3}$ each year, indicating a decrease. d. X - axis: $[0,4]$, Y - axis: $[0,250]$