on their website, a popular bakery downtown published the number of cakes sold each month. cakes sold at a…
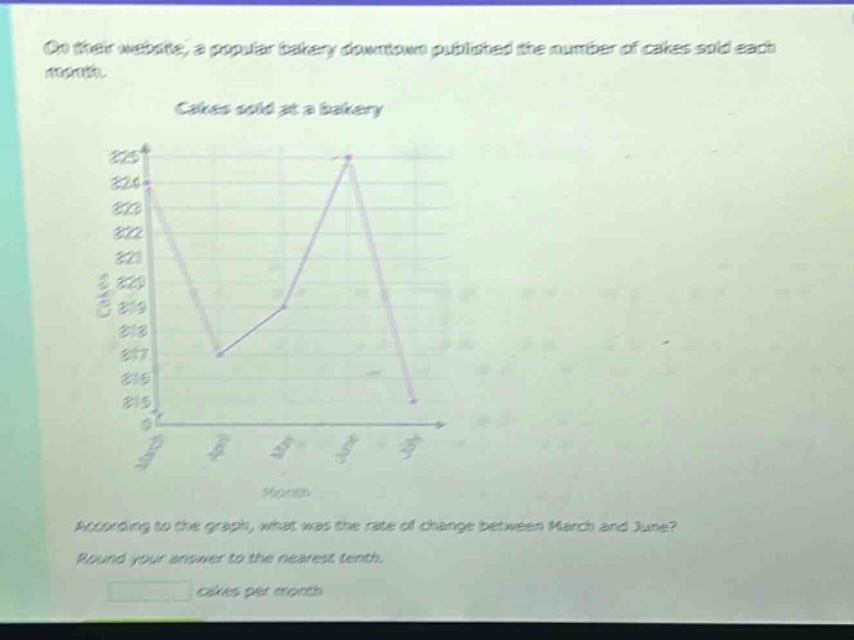
on their website, a popular bakery downtown published the number of cakes sold each month. cakes sold at a bakery according to the graph, what was the rate of change between march and june? round your answer to the nearest tenth. cakes per month
Answer
Explanation:
Step1: Identify the number of cakes sold in March and June
From the graph, the number of cakes sold in March ((x_1 = 3)) is (y_1=817), and the number of cakes sold in June ((x_2 = 6)) is (y_2 = 815).
Step2: Use the rate - of - change formula
The rate - of - change formula is (m=\frac{y_2 - y_1}{x_2 - x_1}). Substitute (x_1 = 3,y_1 = 817,x_2 = 6,y_2 = 815) into the formula: [ \begin{align*} m&=\frac{815 - 817}{6 - 3}\ &=\frac{- 2}{3}\ &\approx - 0.7 \end{align*} ]
Answer:
(-0.7)