trazar el gráfico de la función $f(x)=-3x-1$.
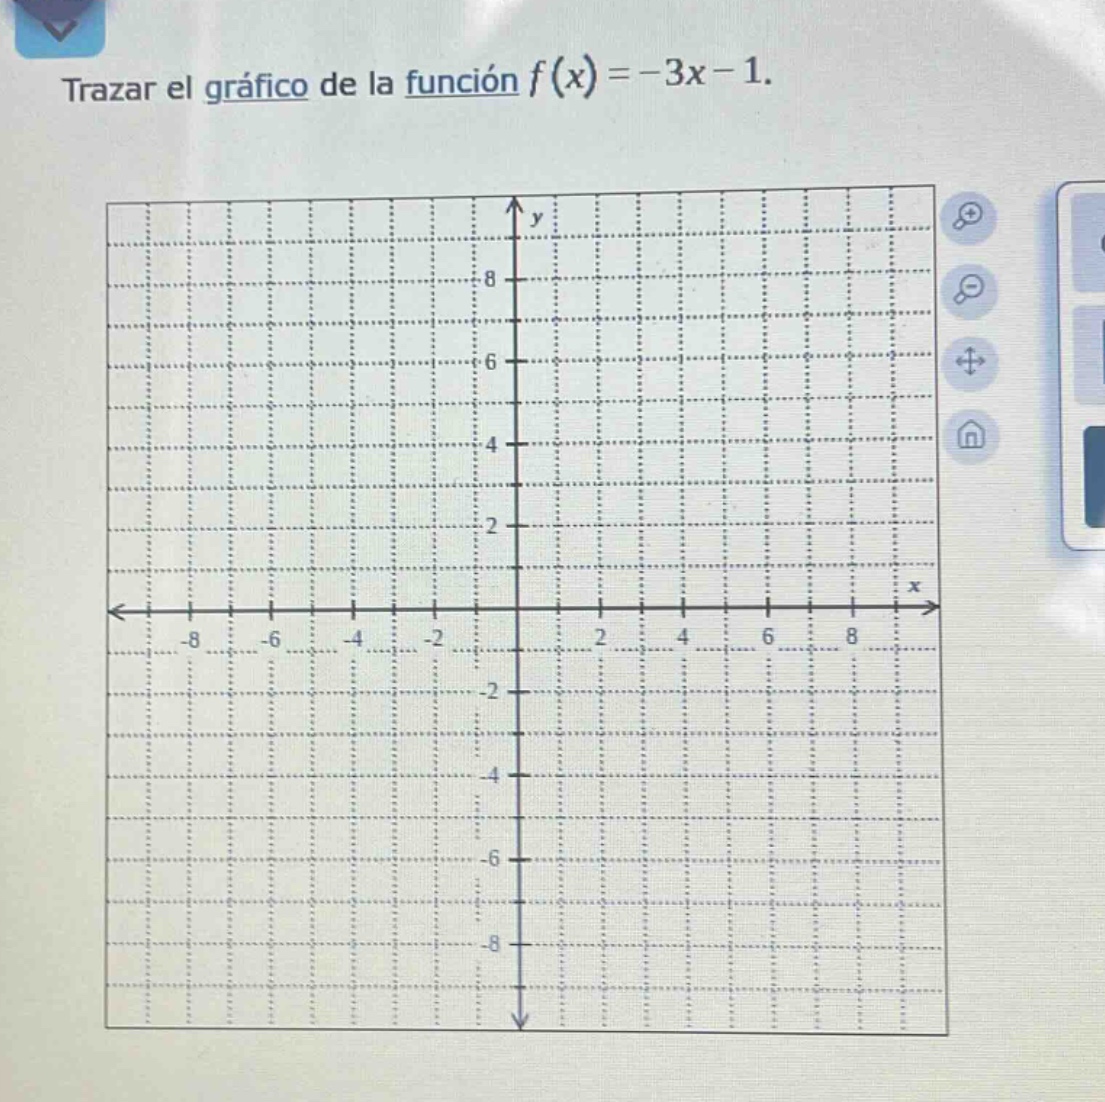
trazar el gráfico de la función $f(x)=-3x-1$.
Answer
Explanation:
Step1: Identify slope and y-intercept
The function $f(x)=-3x-1$ follows the slope-intercept form $y=mx+b$, where $m=-3$ (slope) and $b=-1$ (y-intercept, the point $(0, -1)$).
Step2: Plot the y-intercept
Mark the point $(0, -1)$ on the coordinate grid.
Step3: Use slope to find a second point
Slope $m=\frac{\Delta y}{\Delta x}=\frac{-3}{1}$. From $(0, -1)$, move 1 unit right and 3 units down to get the point $(1, -1-3)=(1, -4)$. Alternatively, move 1 unit left and 3 units up to get $(-1, -1+3)=(-1, 2)$.
Step4: Draw the line
Connect the plotted points with a straight line, extending it across the entire grid.
Answer:
The graph is a straight line passing through points such as $(-1, 2)$, $(0, -1)$, and $(1, -4)$, extending infinitely in both directions.