1. true or false: the piecewise graph below is the ceiling function.
1. true or false: the piecewise graph below is the ceiling function.
Answer
Explanation:
Step1: Recall the ceiling function definition
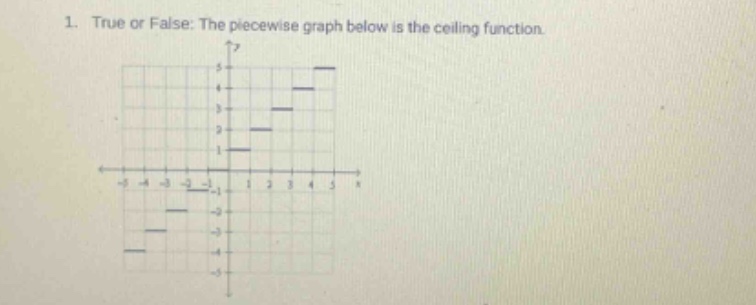
The ceiling function (y = \lceil x\rceil) is defined as the smallest integer greater than or equal to (x). For example, (\lceil1.2\rceil = 2), (\lceil - 1.2\rceil=-1). The graph of the ceiling function has a "step - up" pattern where each step starts at a non - integer (x) value and jumps up at integer (x) values.
Step2: Analyze the given graph
In the ceiling function, for (x\in(n - 1,n]), (y = n) where (n\in\mathbb{Z}). Looking at the given graph, we can check the intervals. For (x\in(-2,-1]), the (y) - value should be (-1) (by the ceiling function definition). But in a general piece - wise graph that is not the ceiling function, we can observe the behavior. If we consider the left - hand limit and right - hand limit at integer values. At (x = k) (integer), (\lim_{x\rightarrow k^{-}}\lceil x\rceil=k) and (\lim_{x\rightarrow k^{+}}\lceil x\rceil=k) (since for (x\in(k - 1,k]), (\lceil x\rceil=k)). The given graph has the correct "ceiling" behavior where for any (x) in an interval ((a,b]) where (b) is an integer, the function value is (b).
Answer:
True