use the derivative f(x)=(x - 1)(x + 2)(x + 5) to determine the local maxima and minima of f and the…
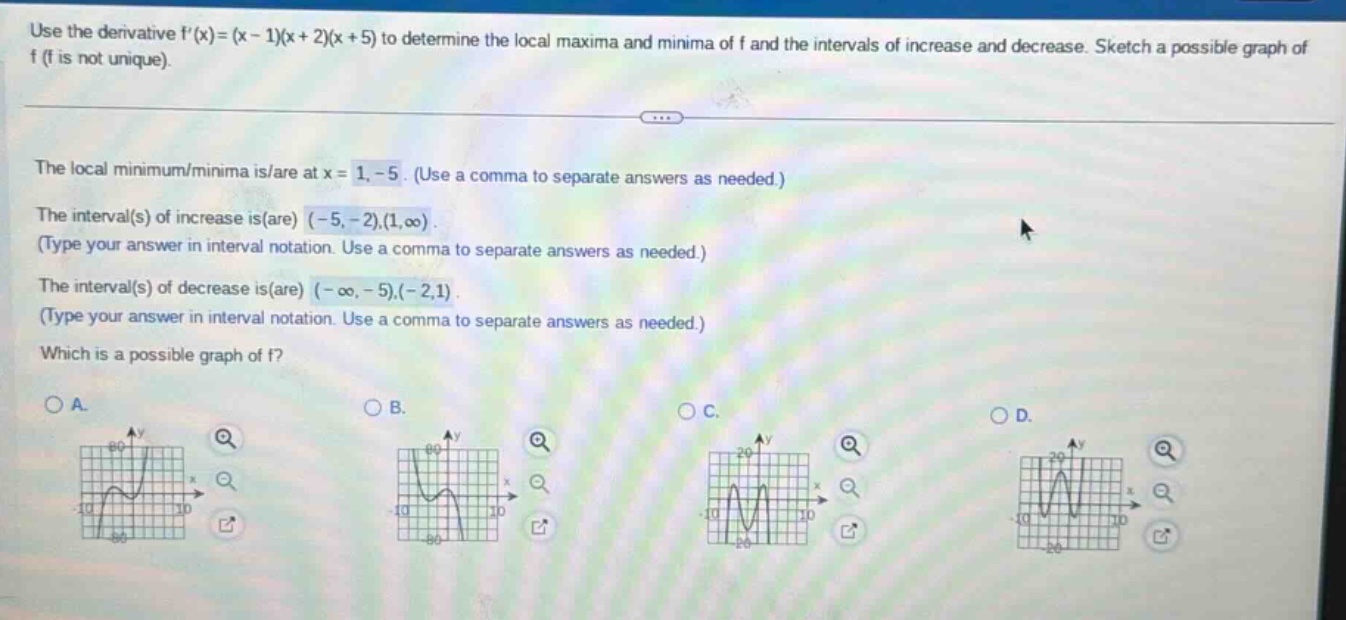
use the derivative f(x)=(x - 1)(x + 2)(x + 5) to determine the local maxima and minima of f and the intervals of increase and decrease. sketch a possible graph of f (f is not unique). the local minimum/minima is/are at x = 1, - 5. (use a comma to separate answers as needed.) the interval(s) of increase is(are) (-5, -2),(1,∞). (type your answer in interval notation. use a comma to separate answers as needed.) the interval(s) of decrease is(are) (-∞, -5),(-2,1). (type your answer in interval notation. use a comma to separate answers as needed.) which is a possible graph of f? a. b. c. d.
Answer
Explanation:
Step1: Find critical points
Set $f'(x)=(x - 1)(x + 2)(x + 5)=0$. Solving gives $x=-5,x=-2,x = 1$. These are the critical - points.
Step2: Test intervals for sign of $f'(x)$
- For $x<-5$, let $x=-6$. Then $f'(-6)=(-6 - 1)(-6 + 2)(-6 + 5)=(-7)\times(-4)\times(-1)<0$, so $f$ is decreasing on $(-\infty,-5)$.
- For $-5<x<-2$, let $x=-3$. Then $f'(-3)=(-3 - 1)(-3 + 2)(-3 + 5)=(-4)\times(-1)\times2>0$, so $f$ is increasing on $(-5,-2)$.
- For $-2<x<1$, let $x = 0$. Then $f'(0)=(0 - 1)(0 + 2)(0 + 5)=(-1)\times2\times5<0$, so $f$ is decreasing on $(-2,1)$.
- For $x>1$, let $x = 2$. Then $f'(2)=(2 - 1)(2 + 2)(2 + 5)=1\times4\times7>0$, so $f$ is increasing on $(1,\infty)$.
Step3: Determine local extrema
Since $f$ changes from decreasing to increasing at $x=-5$ and $x = 1$, $f$ has local minima at $x=-5$ and $x = 1$. Since $f$ changes from increasing to decreasing at $x=-2$, $f$ has a local maximum at $x=-2$.
To sketch the graph:
- The function is decreasing on $(-\infty,-5)$, has a local minimum at $x=-5$, then increases on $(-5,-2)$, has a local maximum at $x=-2$, then decreases on $(-2,1)$, has a local minimum at $x = 1$, and then increases on $(1,\infty)$.
We need to analyze the graphs A, B, C, D based on the above - mentioned behavior of the function. A possible graph should have local minima at $x=-5$ and $x = 1$ and a local maximum at $x=-2$, and should be decreasing and increasing on the correct intervals.
Answer:
We need to see the actual graphs A, B, C, D to select the correct one. But based on the analysis above, the correct graph should have local minima at $x=-5$ and $x = 1$, a local maximum at $x=-2$, be decreasing on $(-\infty,-5)$ and $(-2,1)$, and increasing on $(-5,-2)$ and $(1,\infty)$.