use the drawing tools to form the correct answer on the provided graph. the graph of a sine function is…
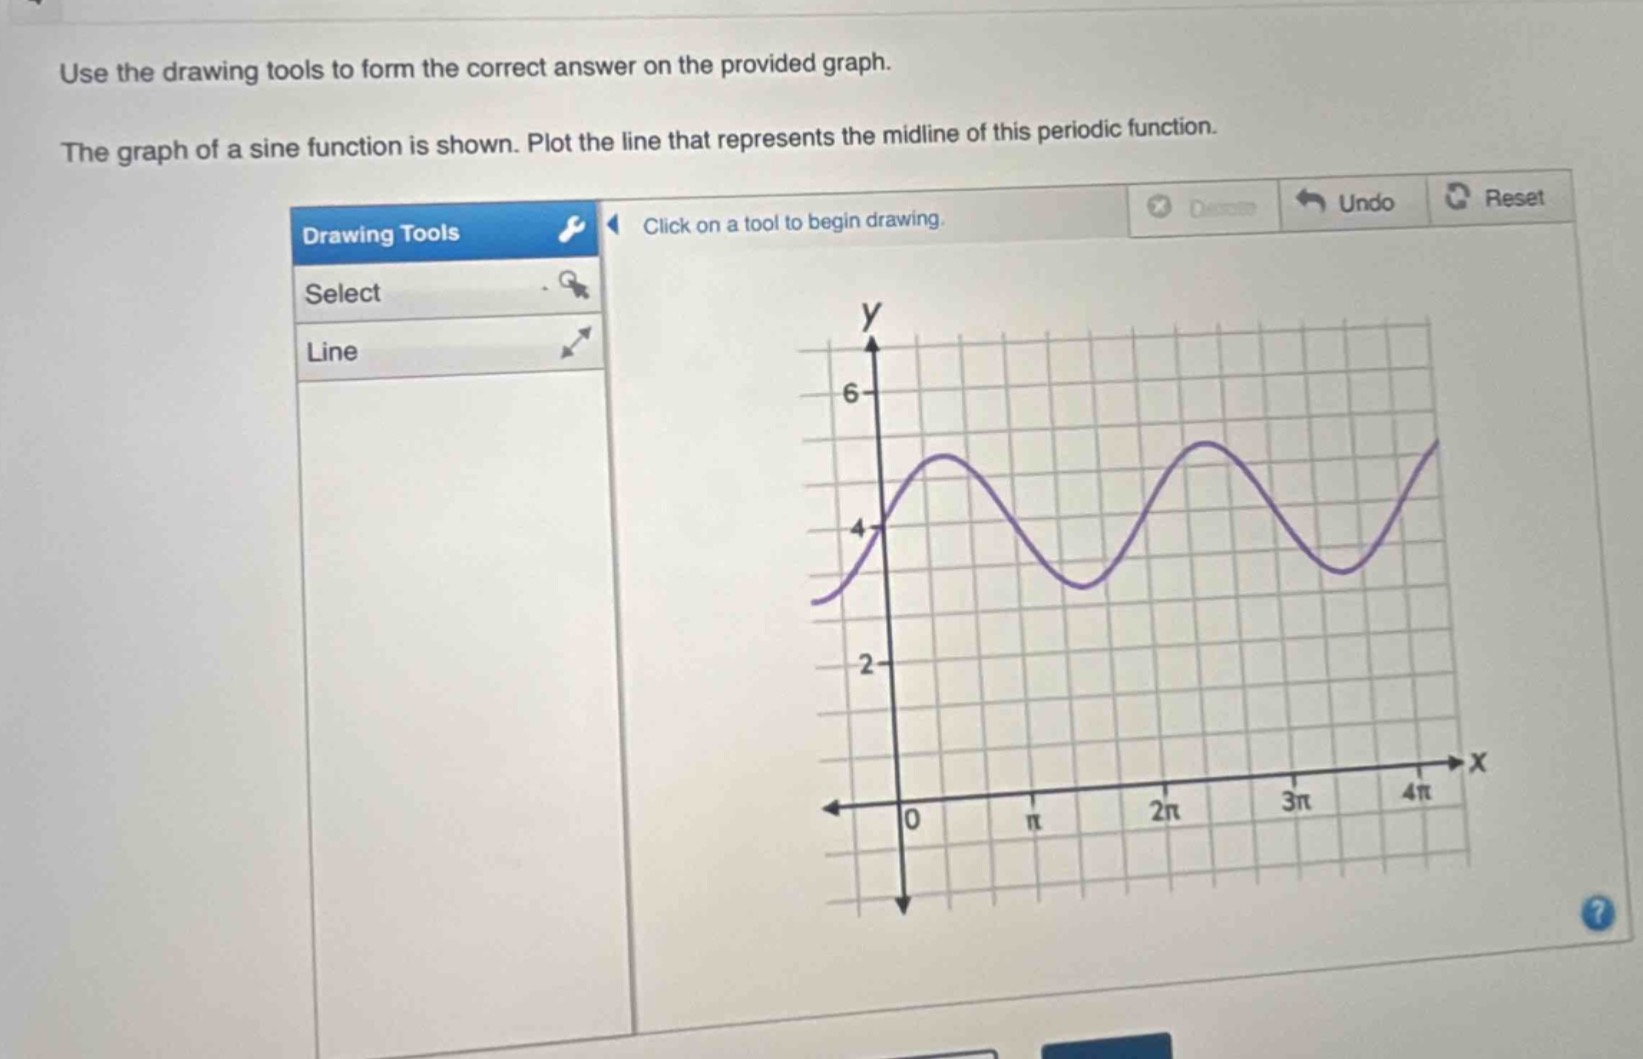
use the drawing tools to form the correct answer on the provided graph. the graph of a sine function is shown. plot the line that represents the midline of this periodic function.
Answer
Explanation:
Step1: Identify max and min values
The maximum value of the sine - function graph is approximately 5 and the minimum value is approximately 3.
Step2: Calculate mid - line value
The formula for the mid - line of a periodic function is $y=\frac{y_{max}+y_{min}}{2}$. So, $y=\frac{5 + 3}{2}=4$.
Answer:
The mid - line is the horizontal line $y = 4$.