use the graph to answer the following questions. (a) over which intervals is the function decreasing? choose…
use the graph to answer the following questions. (a) over which intervals is the function decreasing? choose all that apply. (-∞, -8) (-8, -4) (-8, 0) (0, 5) (5, 9) (9, ∞) (b) at which x - values does the function have local maxima? if there is more than one value, separate them with commas. -8, 0, 9 (c) what is the sign of the functions leading coefficient? negative (d) which of the following is a possibility for the degree of the function? choose that apply. 4 5 6 7 8 9
Answer
Explanation:
Step1: Identify decreasing - intervals
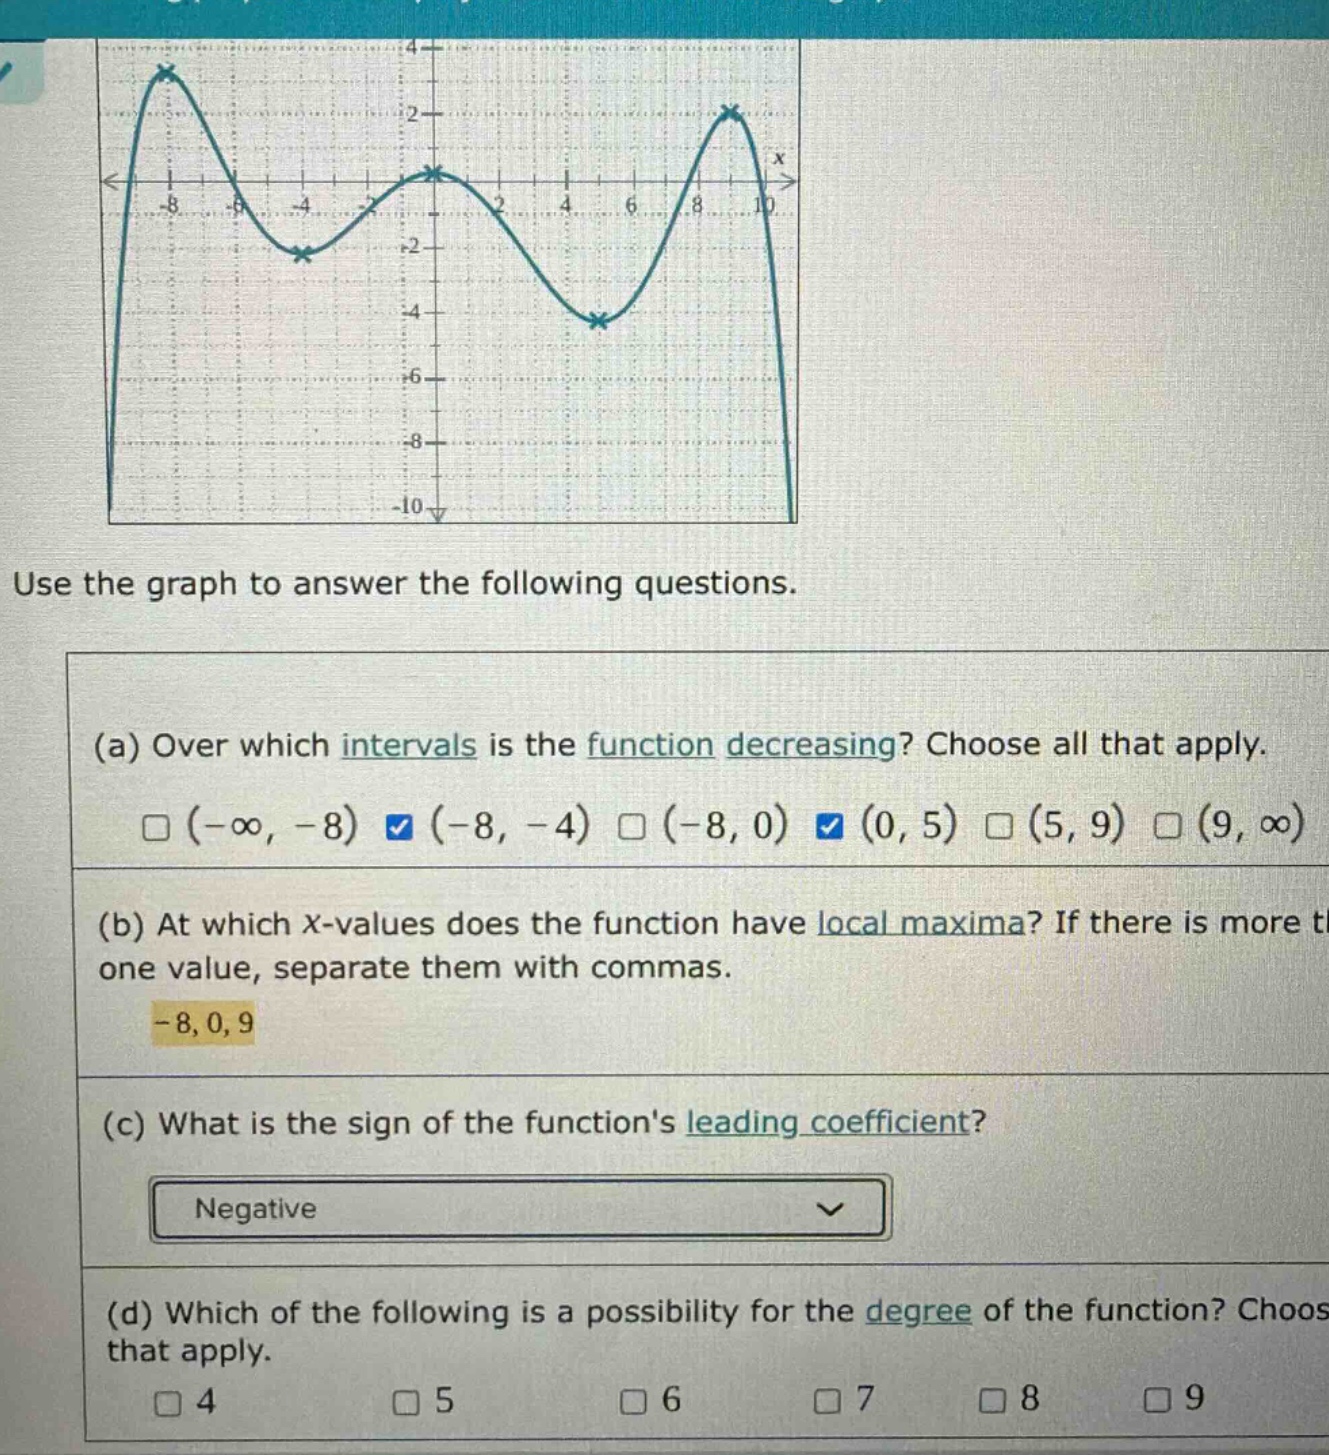
A function is decreasing when the graph goes down as we move from left to right. By observing the graph, we can see that the function is decreasing on the intervals $(-8,-4)$ and $(0,5)$.
Step2: Identify local maxima
Local maxima occur at points where the function changes from increasing to decreasing. From the graph, the $x$ - values of local maxima are $x=-8,0,9$.
Step3: Determine sign of leading - coefficient
Since the graph of the function falls to the left and falls to the right (the "end - behavior" is $y\to-\infty$ as $x\to\pm\infty$), the sign of the leading coefficient is negative.
Step4: Estimate degree of the function
The number of turning points of a polynomial function is at most $n - 1$, where $n$ is the degree of the polynomial. The graph has 4 turning points. So the degree $n$ of the polynomial must satisfy $n-1\geq4$, which means $n\geq5$. Also, since the end - behavior is that of an even - degree polynomial (falls to left and falls to right), possible degrees are 6 and 8.
Answer:
(a) $(-8,-4),(0,5)$ (b) $-8,0,9$ (c) Negative (d) 6,8