use the graph to determine the behavior of the function between the indicated points.\npoints behavior of…
use the graph to determine the behavior of the function between the indicated points.\npoints behavior of the function\na and b increasing constant decreasing\nb and c increasing constant decreasing\nc and d increasing constant decreasing\nd and e increasing constant decreasing
Answer
Explanation:
Step1: Analyze A - B
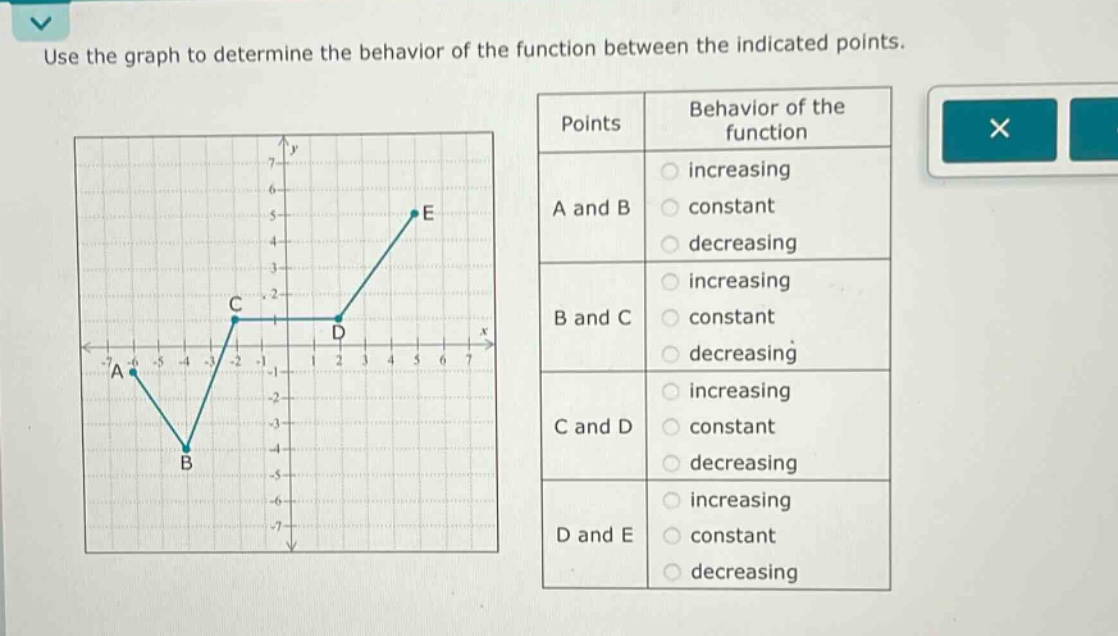
As we move from point A to point B on the x - axis, the y - values of the function are getting smaller.
Step2: Analyze B - C
As we move from point B to point C on the x - axis, the y - values of the function are getting larger.
Step3: Analyze C - D
As we move from point C to point D on the x - axis, the y - values of the function remain the same.
Step4: Analyze D - E
As we move from point D to point E on the x - axis, the y - values of the function are getting larger.
Answer:
A and B: decreasing B and C: increasing C and D: constant D and E: increasing