use the graph to determine the behavior of the function between the indicated points.\npoints behavior of…
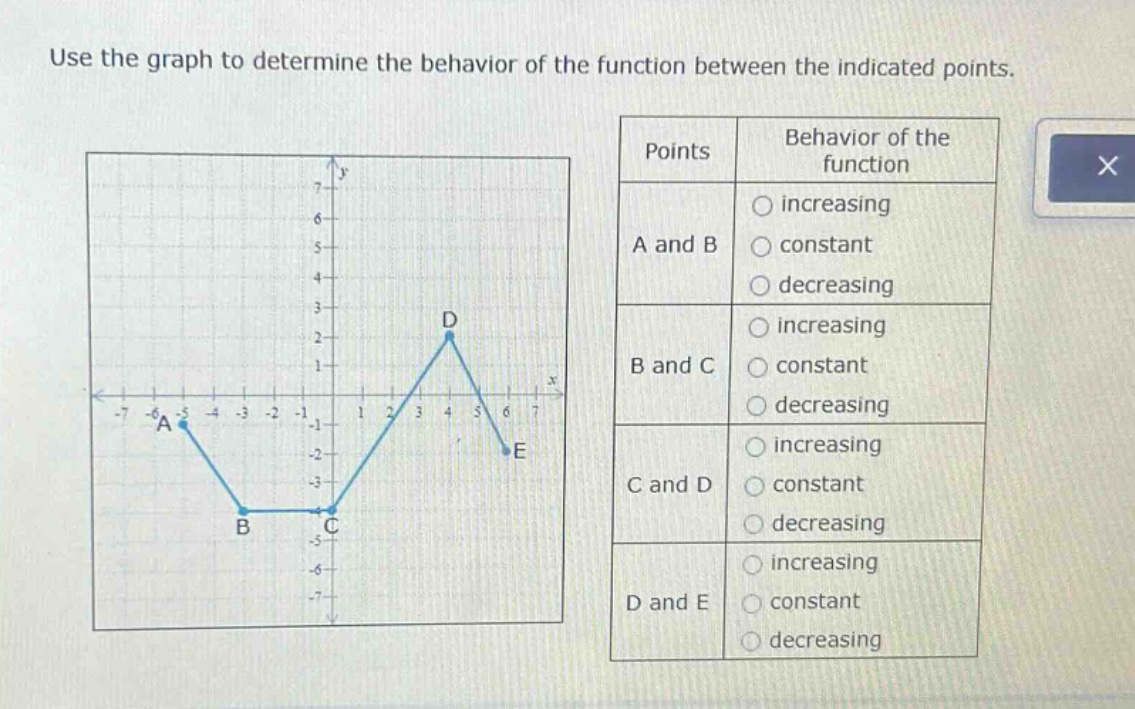
use the graph to determine the behavior of the function between the indicated points.\npoints behavior of the function\na and b increasing\nconstant\ndecreasing\nb and c increasing\nconstant\ndecreasing\nc and d increasing\nconstant\ndecreasing\nd and e increasing\nconstant\ndecreasing
Answer
Explanation:
Step1: Analizar entre A y B
Observando el gráfico, vemos que la función va hacia abajo, es decir, es decreciente.
Step2: Analizar entre B y C
La función se mantiene en la misma altura, es constante.
Step3: Analizar entre C y D
La función va hacia arriba, es creciente.
Step4: Analizar entre D y E
La función va hacia abajo, es decreciente.
Answer:
A and B: decreasing B and C: constant C and D: increasing D and E: decreasing