use the graph to determine the true statement about the end - behavior of the function.\nas the x - values…
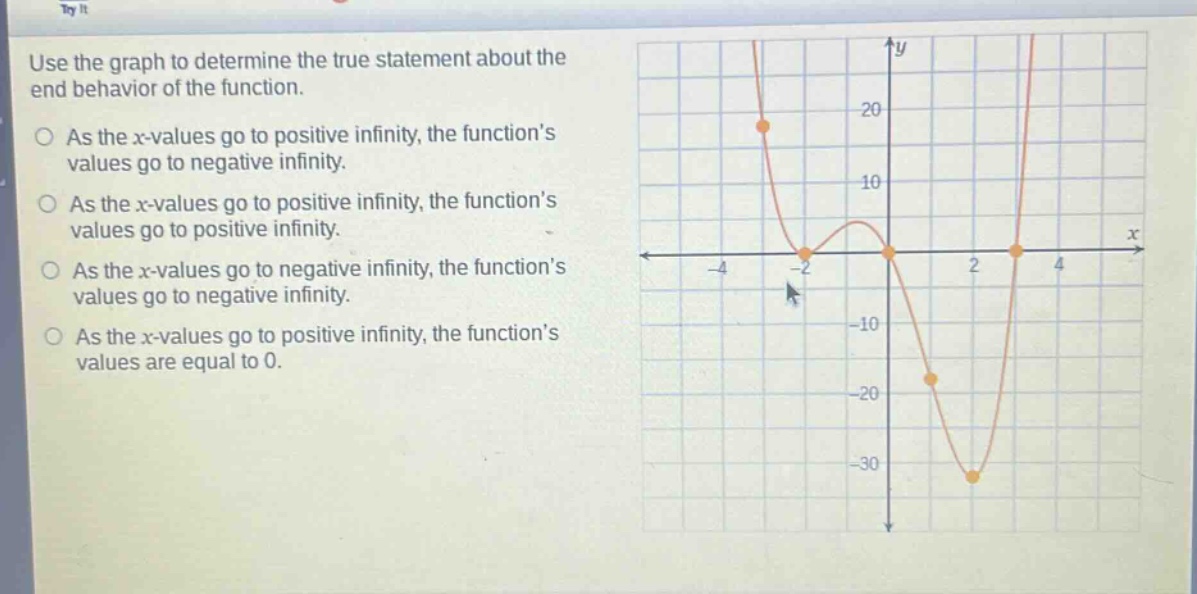
use the graph to determine the true statement about the end - behavior of the function.\nas the x - values go to positive infinity, the function’s values go to negative infinity.\nas the x - values go to positive infinity, the function’s values go to positive infinity.\nas the x - values go to negative infinity, the function’s values go to negative infinity.\nas the x - values go to positive infinity, the function’s values are equal to 0.
Answer
Answer:
As the x - values go to positive infinity, the function's values go to positive infinity.
Explanation:
Step1: Observe right - hand side of graph
As we move towards positive x - axis (x goes to positive infinity), the y - values of the function are increasing.
Step2: Determine end - behavior
Since y is increasing as x goes to positive infinity, the function's values go to positive infinity.