use the graph of f to draw the graph of its inverse function. use the graphing tool to graph the function…
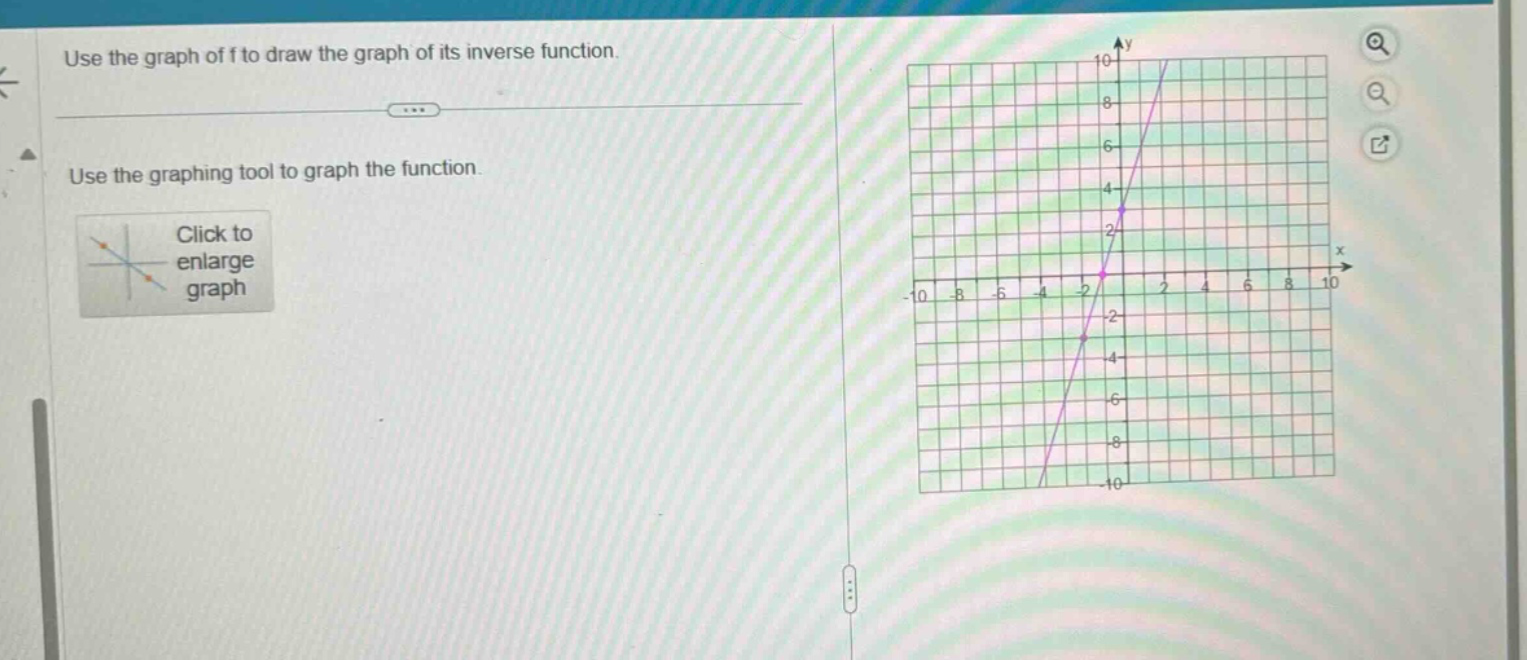
use the graph of f to draw the graph of its inverse function. use the graphing tool to graph the function. click to enlarge graph
Answer
Explanation:
Step1: Recall the property of inverse function graphs
The graph of a function (y = f(x)) and its inverse (y = f^{-1}(x)) are symmetric about the line (y=x).
Step2: Identify key points on (y = f(x))
From the given graph of (y = f(x)), we can see key points. For example, if (f(x)) passes through the point ((a,b)), then (f^{-1}(x)) passes through the point ((b,a)). Let's assume two points on (y = f(x)): when (x = 0), (y=3) (a point ((0,3)) on (y = f(x))) and when (x=- 1), (y = 0) (a point ((-1,0)) on (y = f(x))). Then the corresponding points on (y = f^{-1}(x)) are ((3,0)) and ((0, - 1)) respectively.
Step3: Plot the inverse function
Using the symmetry about (y = x), take several points from the original function (y=f(x)), swap their (x) and (y) coordinates, and then connect these new points to draw the graph of (y = f^{-1}(x)).
Answer:
Graph the inverse function by reflecting the given function (y = f(x)) about the line (y=x) using the point - swapping method as described above.