use the graph to estimate the x - and y - intercepts of the function and describe where the function is…
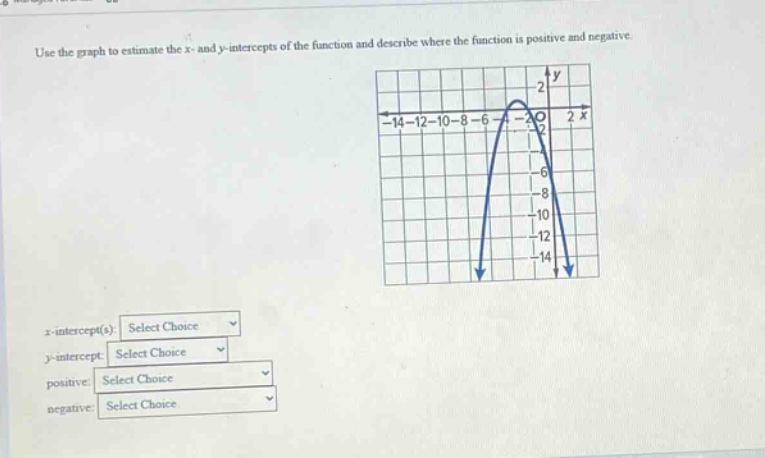
use the graph to estimate the x - and y - intercepts of the function and describe where the function is positive and negative.\nx - intercept(s): select choice\ny - intercept: select choice\npositive: select choice\nnegative: select choice
Answer
Explanation:
Step1: Find x - intercepts
The x - intercepts are the points where the graph crosses the x - axis. From the graph, it crosses at approximately $x=- 8$ and $x = - 2$.
Step2: Find y - intercept
The y - intercept is the point where the graph crosses the y - axis. From the graph, it crosses at approximately $y=-8$.
Step3: Determine where function is positive
The function is positive when the graph is above the x - axis. So, it is positive for $-8<x<-2$.
Step4: Determine where function is negative
The function is negative when the graph is below the x - axis. So, it is negative for $x < - 8$ or $x>-2$.
Answer:
x - intercept(s): $x=-8,x = - 2$ y - intercept: $y=-8$ positive: $-8<x<-2$ negative: $x < - 8$ or $x>-2$