use the graph below to fill in each entry of the grid with positive, negative or zero. y = f(x) a b c f f f…
use the graph below to fill in each entry of the grid with positive, negative or zero. y = f(x) a b c f f f a b c
Answer
Explanation:
Step1: Analyze (f(x)) values
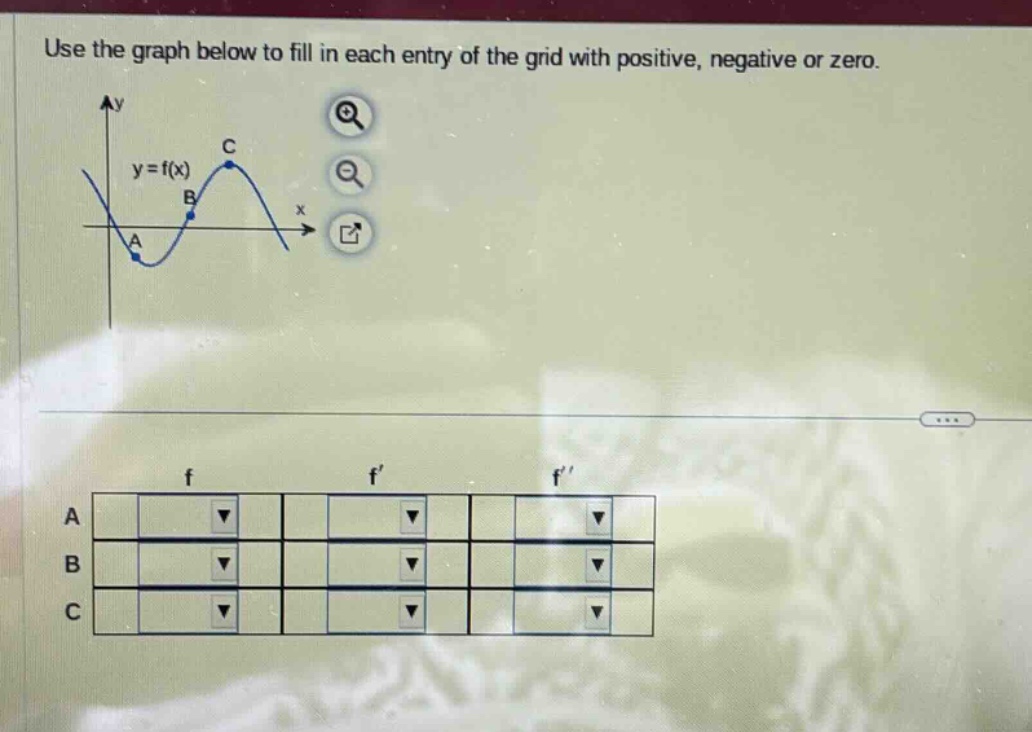
At point A, the graph is below the x - axis, so (f(A)<0). At point B, the graph is above the x - axis, so (f(B)>0). At point C, the graph is above the x - axis, so (f(C)>0).
Step2: Analyze (f^{\prime}(x)) values
The derivative (f^{\prime}(x)) represents the slope of the tangent line. At point A, the function is increasing, so (f^{\prime}(A)>0). At point B, the function has a horizontal tangent, so (f^{\prime}(B) = 0). At point C, the function is decreasing, so (f^{\prime}(C)<0).
Step3: Analyze (f^{\prime\prime}(x)) values
The second - derivative (f^{\prime\prime}(x)) represents the concavity. At point A, the graph is concave up, so (f^{\prime\prime}(A)>0). At point B, the graph changes concavity (inflection point), so (f^{\prime\prime}(B)=0). At point C, the graph is concave down, so (f^{\prime\prime}(C)<0).
| Point | (f) | (f^{\prime}) | (f^{\prime\prime}) |
|---|---|---|---|
| A | Negative | Positive | Positive |
| B | Positive | Zero | Zero |
| C | Positive | Negative | Negative |
Answer:
| Point | (f) | (f^{\prime}) | (f^{\prime\prime}) |
|---|---|---|---|
| A | Negative | Positive | Positive |
| B | Positive | Zero | Zero |
| C | Positive | Negative | Negative |