use the graph of f’ and f’’ to find the critical points and inflection points of f, the intervals on which f…
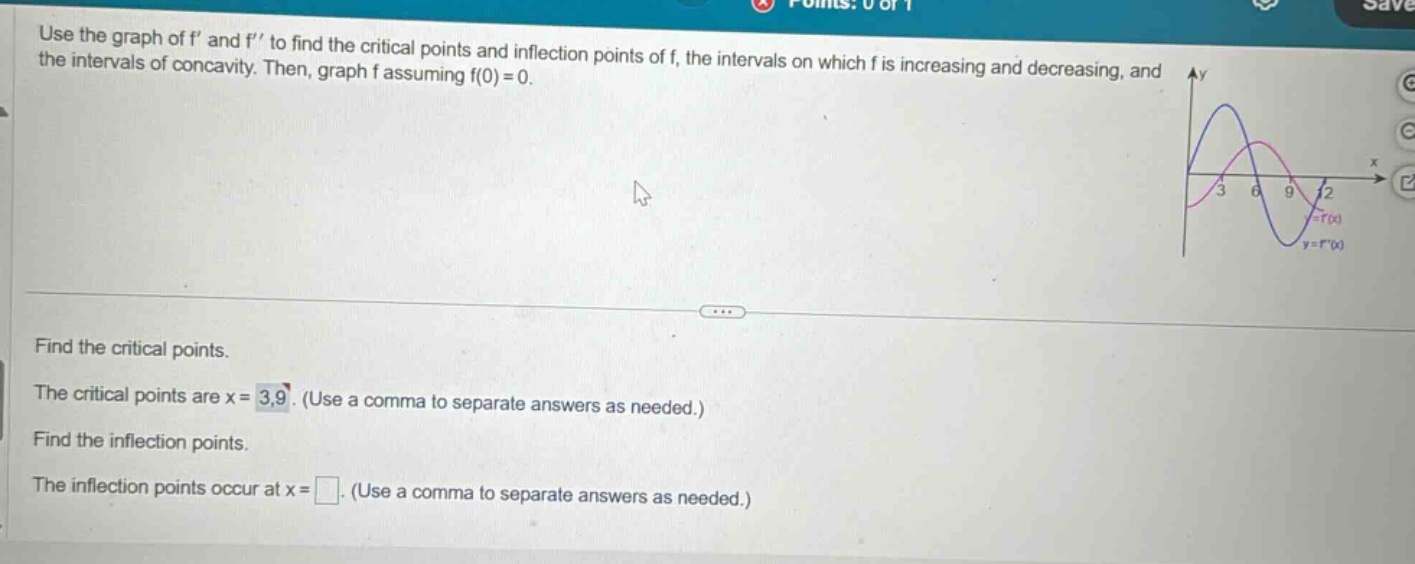
use the graph of f’ and f’’ to find the critical points and inflection points of f, the intervals on which f is increasing and decreasing, and the intervals of concavity. then, graph f assuming f(0)=0. find the critical points. the critical points are x = 3,9. (use a comma to separate answers as needed.) find the inflection points. the inflection points occur at x = . (use a comma to separate answers as needed.)
Answer
Explanation:
Step1: Recall inflection - point definition
Inflection points occur where $f''(x)=0$ or $f''(x)$ is undefined.
Step2: Identify from the graph
Look at the graph of $y = f''(x)$. Find the $x$ - values where the graph of $y = f''(x)$ crosses the $x$ - axis.
Answer:
The inflection points occur at $x = 6,12$ (assuming the graph of $y = f''(x)$ crosses the $x$ - axis at $x = 6$ and $x = 12$ based on the visible part of the graph).