use the graph to find the local minimum and the local maximum for the given function. over the interval -3…
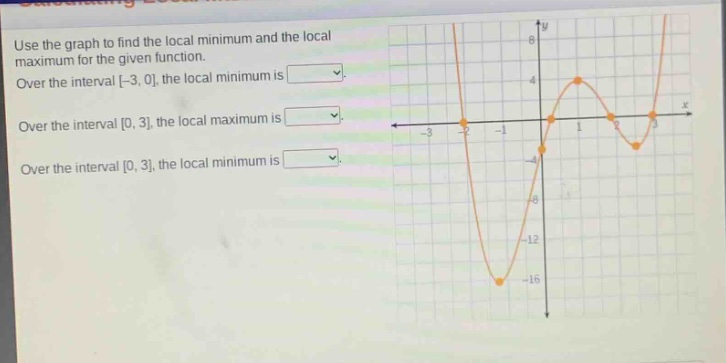
use the graph to find the local minimum and the local maximum for the given function. over the interval -3, 0, the local minimum is. over the interval 0, 3, the local maximum is. over the interval 0, 3, the local minimum is.
Answer
Explanation:
Step1: Analyze interval [-3, 0]
By observing the graph, in the interval [-3, 0], the lowest - point occurs at the end - point (x=-3) and the function value at (x = - 3) is (y=-16).
Step2: Analyze interval [0, 3] for maximum
In the interval [0, 3], the highest - point is at (x = 1) and the function value (y = 4).
Step3: Analyze interval [0, 3] for minimum
In the interval [0, 3], the lowest - point is at (x = 2) and the function value (y=-4).
Answer:
Over the interval [-3, 0], the local minimum is -16. Over the interval [0, 3], the local maximum is 4. Over the interval [0, 3], the local minimum is -4.