use the graph of function below to state in what interval(s) the function is increasing and decreasing…
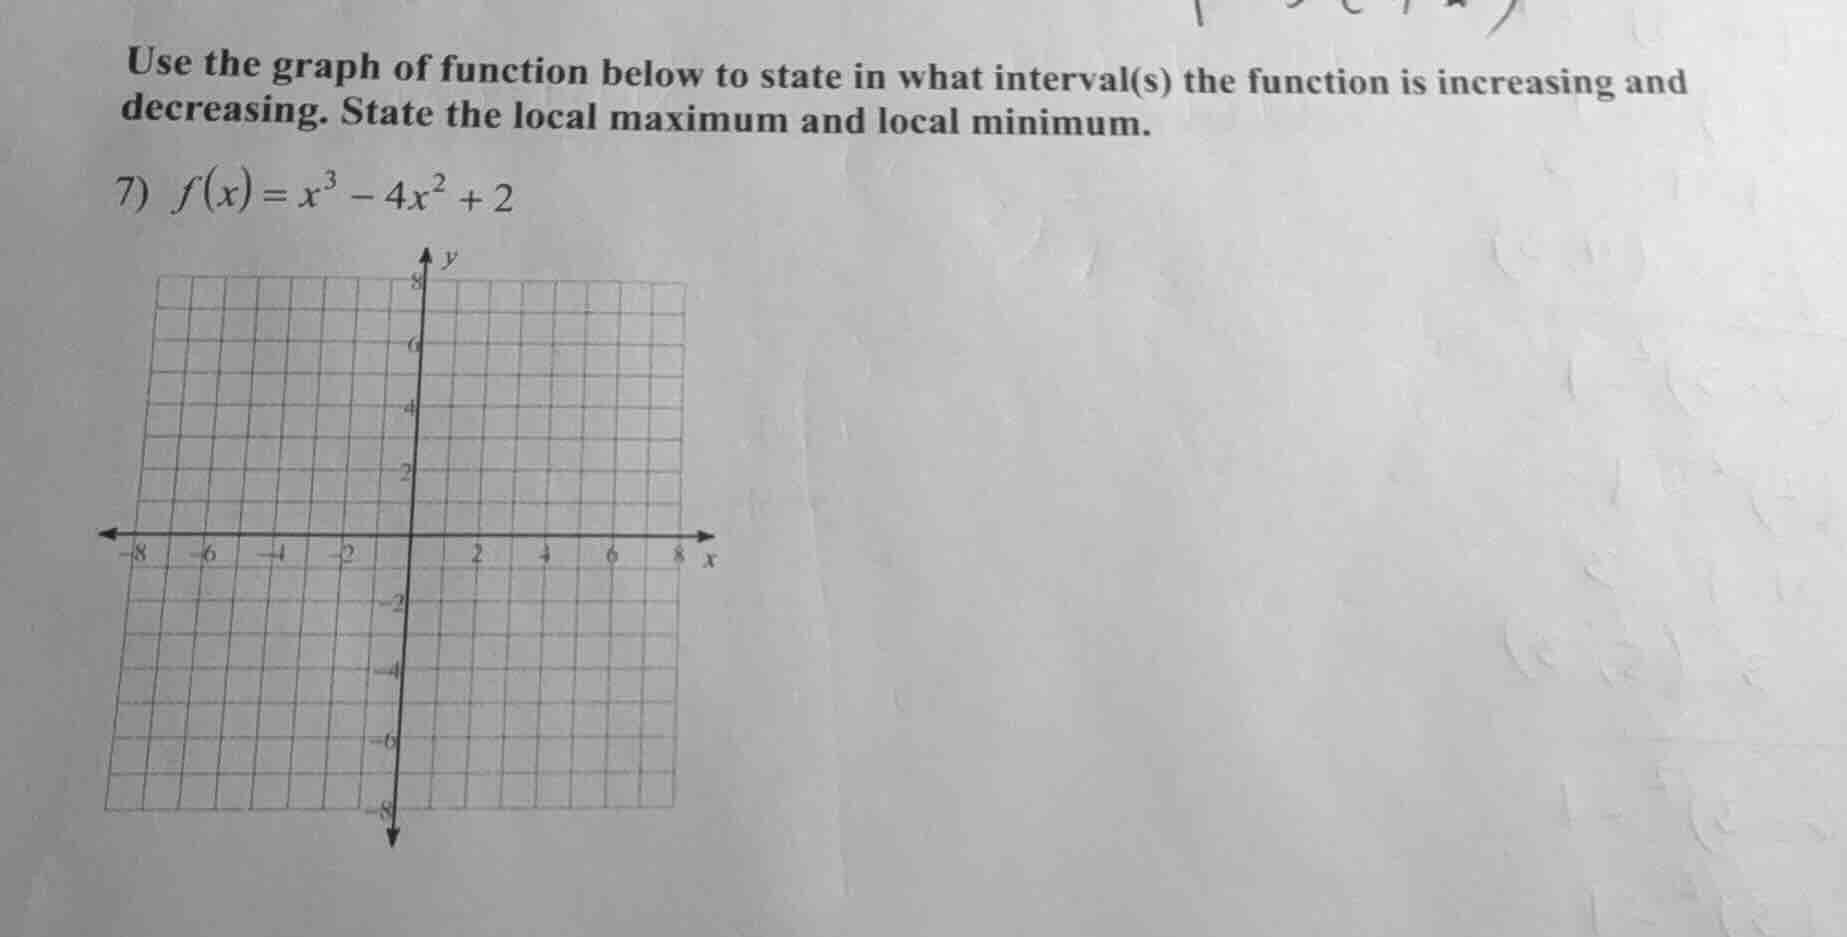
use the graph of function below to state in what interval(s) the function is increasing and decreasing. state the local maximum and local minimum.\n7) $f(x) = x^3 - 4x^2 + 2$
Answer
Explanation:
Step1: Find the derivative of the function
$$f'(x) = 3x^2 - 8x$$
Step2: Determine critical points by setting derivative to zero
$$3x^2 - 8x = 0 \implies x(3x - 8) = 0 \implies x = 0, x = \frac{8}{3} \approx 2.67$$
Step3: Identify increasing and decreasing intervals
$$f'(x) > 0 \text{ on } (-\infty, 0) \cup (\frac{8}{3}, \infty); f'(x) < 0 \text{ on } (0, \frac{8}{3})$$
Step4: Calculate local maximum and minimum values
$$f(0) = 2; f(\frac{8}{3}) = (\frac{8}{3})^3 - 4(\frac{8}{3})^2 + 2 = \frac{512}{27} - \frac{256}{9} + 2 = -\frac{202}{27} \approx -7.48$$
Answer:
Increasing interval: $(-\infty, 0) \cup (\frac{8}{3}, \infty)$ Decreasing interval: $(0, \frac{8}{3})$ Local maximum: $(0, 2)$ Local minimum: $(\frac{8}{3}, -\frac{202}{27})$ or approximately $(2.67, -7.48)$