use the graph to identify the amplitude for each function shown. the amplitude of the function shown in…
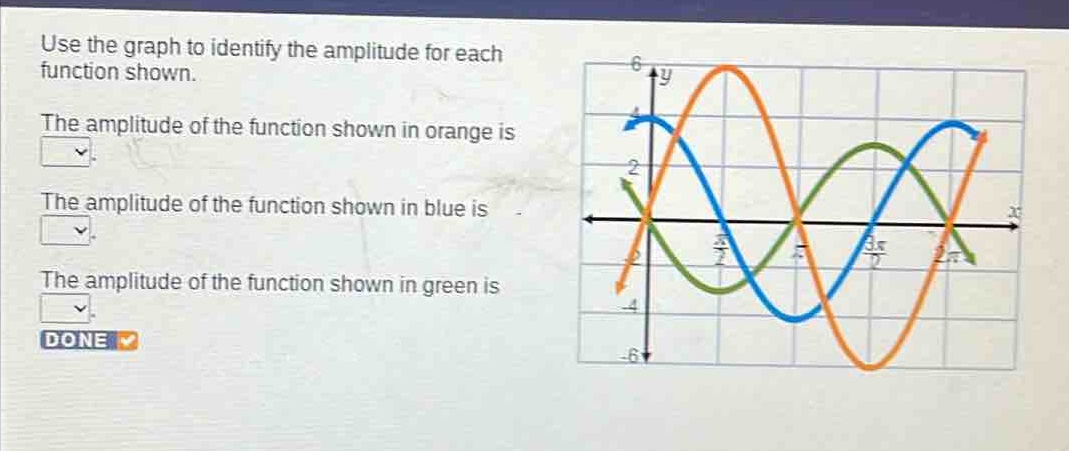
use the graph to identify the amplitude for each function shown. the amplitude of the function shown in orange is. the amplitude of the function shown in blue is. the amplitude of the function shown in green is. done
Answer
Explanation:
Step1: Recall amplitude definition
The amplitude of a periodic - function (y = A\sin(Bx - C)+D) or (y = A\cos(Bx - C)+D) is given by (|A|), and geometrically, it is half the vertical distance between the maximum and minimum values of the function.
Step2: Analyze orange - function
For the orange function, the maximum value is (y = 6) and the minimum value is (y=-6). The vertical distance between the maximum and minimum is (6 - (-6)=12). So the amplitude (A_1=\frac{12}{2}=6).
Step3: Analyze blue - function
For the blue function, the maximum value is (y = 2) and the minimum value is (y=-2). The vertical distance between the maximum and minimum is (2-(-2) = 4). So the amplitude (A_2=\frac{4}{2}=2).
Step4: Analyze green - function
For the green function, the maximum value is (y = 2) and the minimum value is (y=-2). The vertical distance between the maximum and minimum is (2-(-2)=4). So the amplitude (A_3=\frac{4}{2}=2).
Answer:
The amplitude of the function shown in orange is 6. The amplitude of the function shown in blue is 2. The amplitude of the function shown in green is 2.