use the graph of the rational function to complete the following statement. as x → - 1⁺, f(x) → ___. as x →…
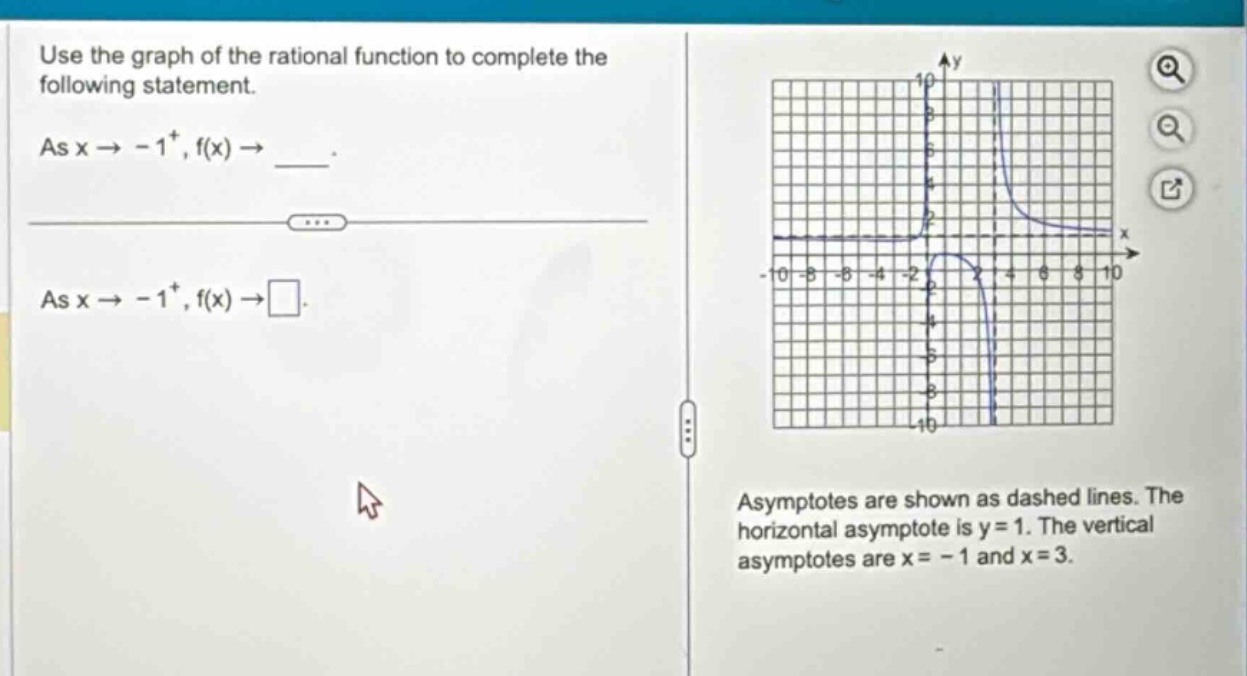
use the graph of the rational function to complete the following statement. as x → - 1⁺, f(x) → ___. as x → - 1⁺, f(x) → □. asymptotes are shown as dashed lines. the horizontal asymptote is y = 1. the vertical asymptotes are x = - 1 and x = 3.
Answer
Explanation:
Step1: Understand the notation
The notation $x\to - 1^{+}$ means $x$ approaches - 1 from the right - hand side.
Step2: Analyze the graph
We look at the behavior of the graph of the rational function as $x$ approaches - 1 from the right. Since $x = - 1$ is a vertical asymptote, and from the graph, as $x$ approaches - 1 from the right, the function values $f(x)$ decrease without bound.
Answer:
$-\infty$