use the graph of f to sketch a graph of f. choose the correct graph of f.
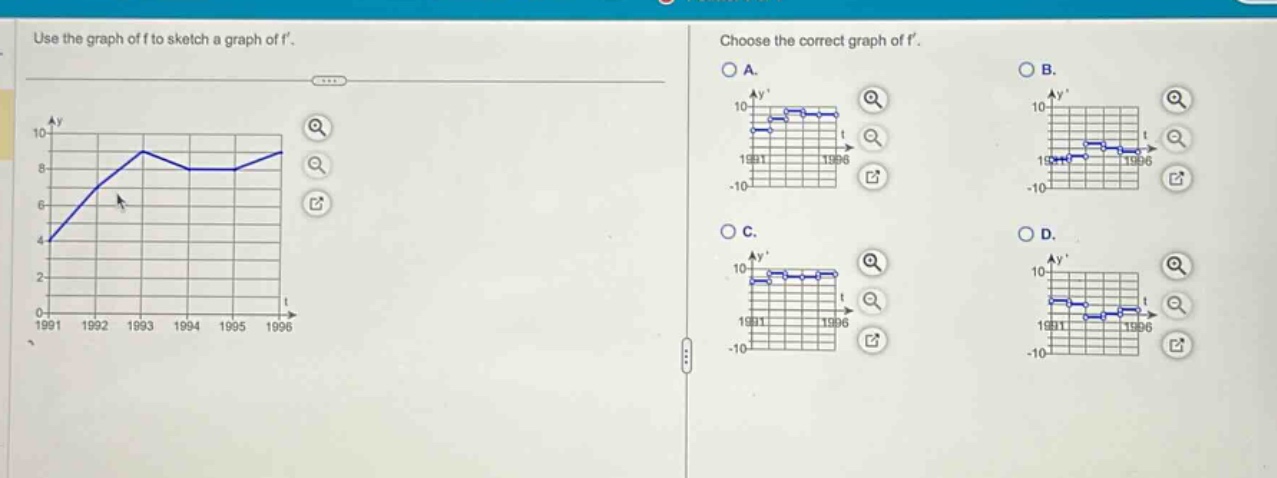
use the graph of f to sketch a graph of f. choose the correct graph of f.
Answer
Explanation:
Step1: Analyze increasing - decreasing intervals
When (f(x)) is increasing, (f'(x)>0). When (f(x)) is decreasing, (f'(x)<0). The function (f(x)) is increasing from 1991 - 1993, decreasing from 1993 - 1995, and increasing from 1995 - 1996. So (f'(x)) should be positive from 1991 - 1993, negative from 1993 - 1995, and positive from 1995 - 1996.
Step2: Analyze slope at critical points
At the local maximum (around 1993) of (f(x)), the slope of (f(x)) is 0, so (f'(x) = 0) at that point. At the local minimum (not applicable here in a strict sense as the behavior changes from decreasing to increasing smoothly around 1995), the slope of (f(x)) is also 0, so (f'(x)=0) around 1995.
Answer:
Based on the above - mentioned analysis, we need to find the graph of (f'(x)) that has positive values when (f(x)) is increasing, negative values when (f(x)) is decreasing, and is 0 at the points where the direction of increase - decrease changes. Without seeing the actual options clearly in terms of their details about positive/negative intervals and zero - crossing points, we can't give a specific letter answer. But the general approach is as described above. If we assume the options follow the correct behavior based on the increasing - decreasing analysis of (f(x)), we would choose the option that has positive (y) - values for the increasing intervals of (f(x)), negative (y) - values for the decreasing intervals of (f(x)) and (y = 0) at the turning points of (f(x)).