use the graphing tool to determine the true statements regarding the represented function. check all that…
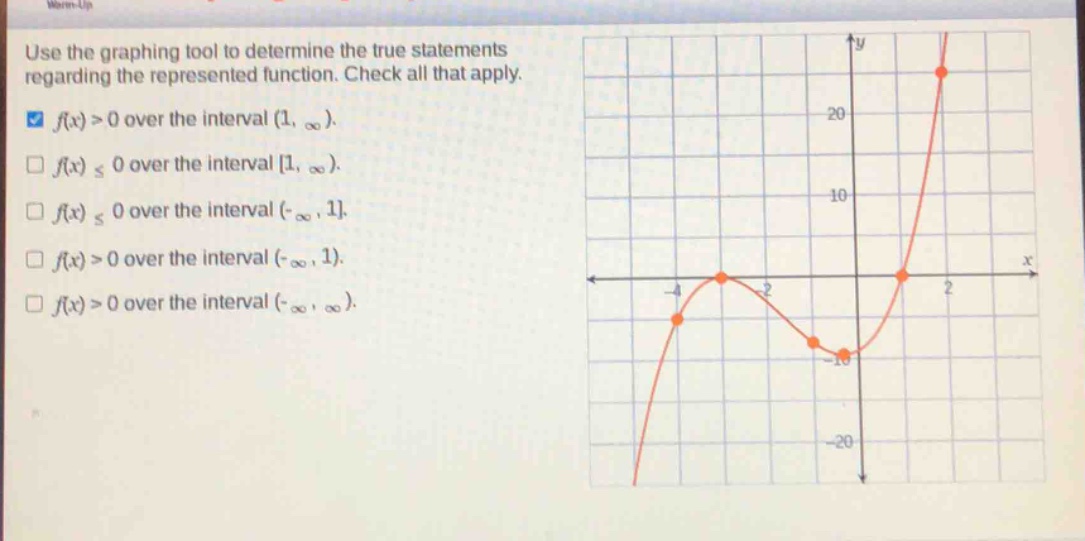
use the graphing tool to determine the true statements regarding the represented function. check all that apply. f(x)>0 over the interval (1, ∞). f(x) ≤ 0 over the interval 1, ∞). f(x) ≤ 0 over the interval (-∞, 1. f(x)>0 over the interval (-∞, 1). f(x)>0 over the interval (-∞, ∞).
Answer
Explanation:
Step1: Analyze function above x - axis
The function (y = f(x)) is above the (x) - axis (i.e., (f(x)>0)) when its graph lies above the (x) - axis.
Step2: Check intervals
Looking at the graph, for (x\in(1,\infty)), the graph of (y = f(x)) is above the (x) - axis, so (f(x)>0) over the interval ((1,\infty)). For (x\in(-\infty,1)), the graph is below the (x) - axis in some parts of this interval, so (f(x)>0) is not true for all (x\in(-\infty,1)) and (f(x)\leq0) is not true for all (x\in(-\infty,1)). Also, (f(x)\leq0) is not true for all (x\in[1,\infty)) and (f(x)>0) is not true for all (x\in(-\infty,\infty)).
Answer:
(f(x)>0) over the interval ((1,\infty))