using a graph to analyze a functional relationship - tutorial - level h\nwhat do these segments of the graph…
using a graph to analyze a functional relationship - tutorial - level h\nwhat do these segments of the graph tell us?\nbake stars oven temperature as a function of time\nthe temperature is increasing.\nthe temperature is 0.\nthe change in the temperature was 0.\nthe temperature is constant.
Answer
Explanation:
Step1: Analyze increasing - slope segments
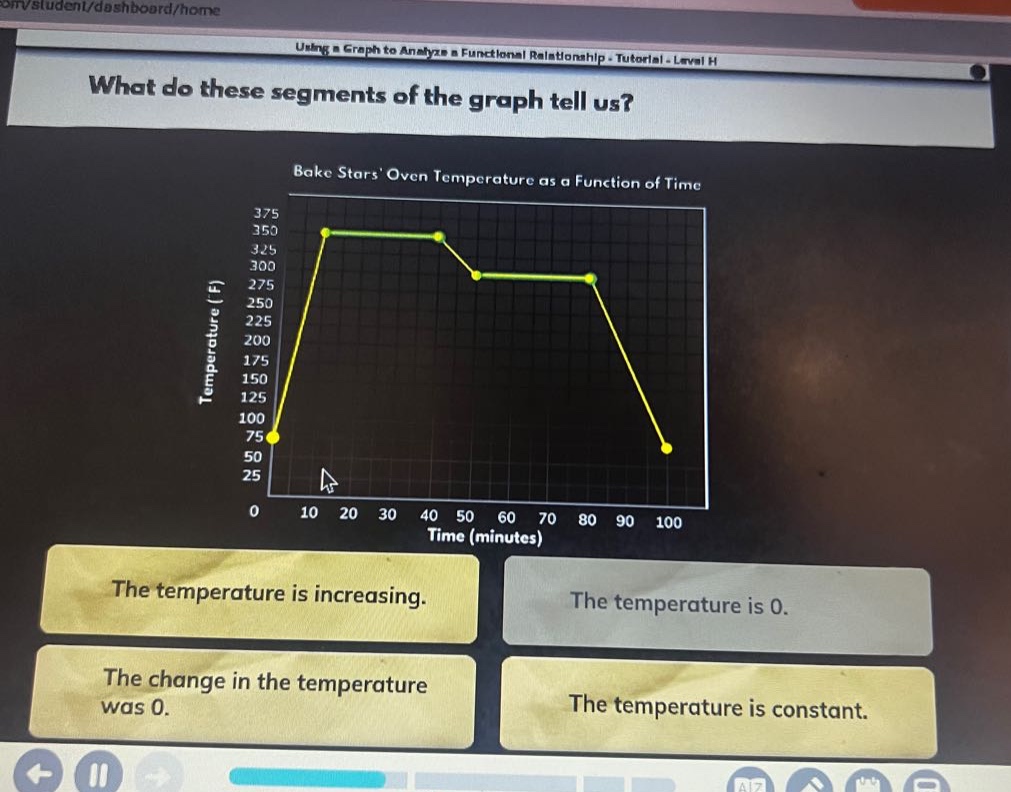
In the initial part of the graph, as time increases, the temperature value on the y - axis also increases. So, for the first segment, the temperature is increasing.
Step2: Analyze horizontal - slope segments
The flat segments of the graph (e.g., from around 10 - 40 minutes and 50 - 70 minutes) have a slope of 0. Since slope = $\frac{\Delta y}{\Delta x}$ and $\Delta y = 0$ for these segments, the change in temperature was 0 and the temperature is constant during these intervals.
Step3: Analyze decreasing - slope segments
In the later part of the graph (e.g., from 70 - 100 minutes), as time increases, the temperature value on the y - axis decreases. But this is not among the given options. Also, the temperature is never 0 during the time - interval shown on the graph.
Answer:
The temperature is increasing; The change in the temperature was 0; The temperature is constant