using the sign chart for f(x)=x^3(x - 4)^2(x + 4)^2, and only that sign chart, what conclusions can be drawn…
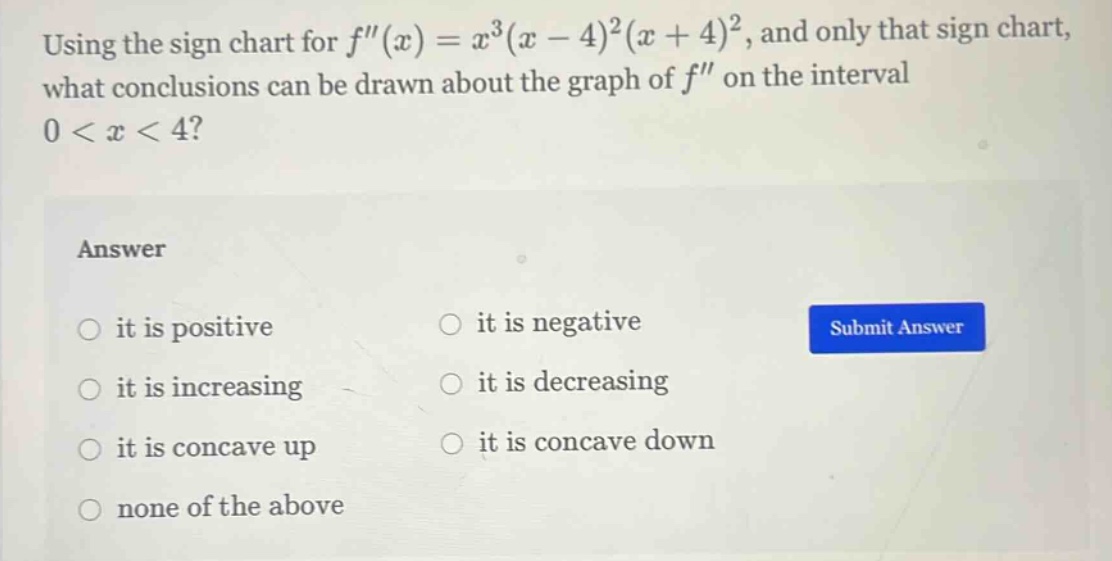
using the sign chart for f(x)=x^3(x - 4)^2(x + 4)^2, and only that sign chart, what conclusions can be drawn about the graph of f on the interval 0 < x < 4? answer it is positive it is negative it is increasing it is decreasing it is concave up it is concave down none of the above
Answer
Explanation:
Step1: Analyze the factors on the interval
On the interval (0 < x<4), consider (f''(x)=x^{3}(x - 4)^{2}(x + 4)^{2}). The factor ((x - 4)^{2}\geq0) and ((x + 4)^{2}>0) for all real - x. Also, for (0 < x<4), (x^{3}>0).
Step2: Determine the sign of (f''(x))
Since (x^{3}>0), ((x - 4)^{2}\geq0), and ((x + 4)^{2}>0) on the interval (0 < x<4), then (f''(x)=x^{3}(x - 4)^{2}(x + 4)^{2}>0) on the interval (0 < x<4).
Answer:
it is positive