we do: the graph below represents the change in temperature (f) that takes place in a blast furnace. use the…
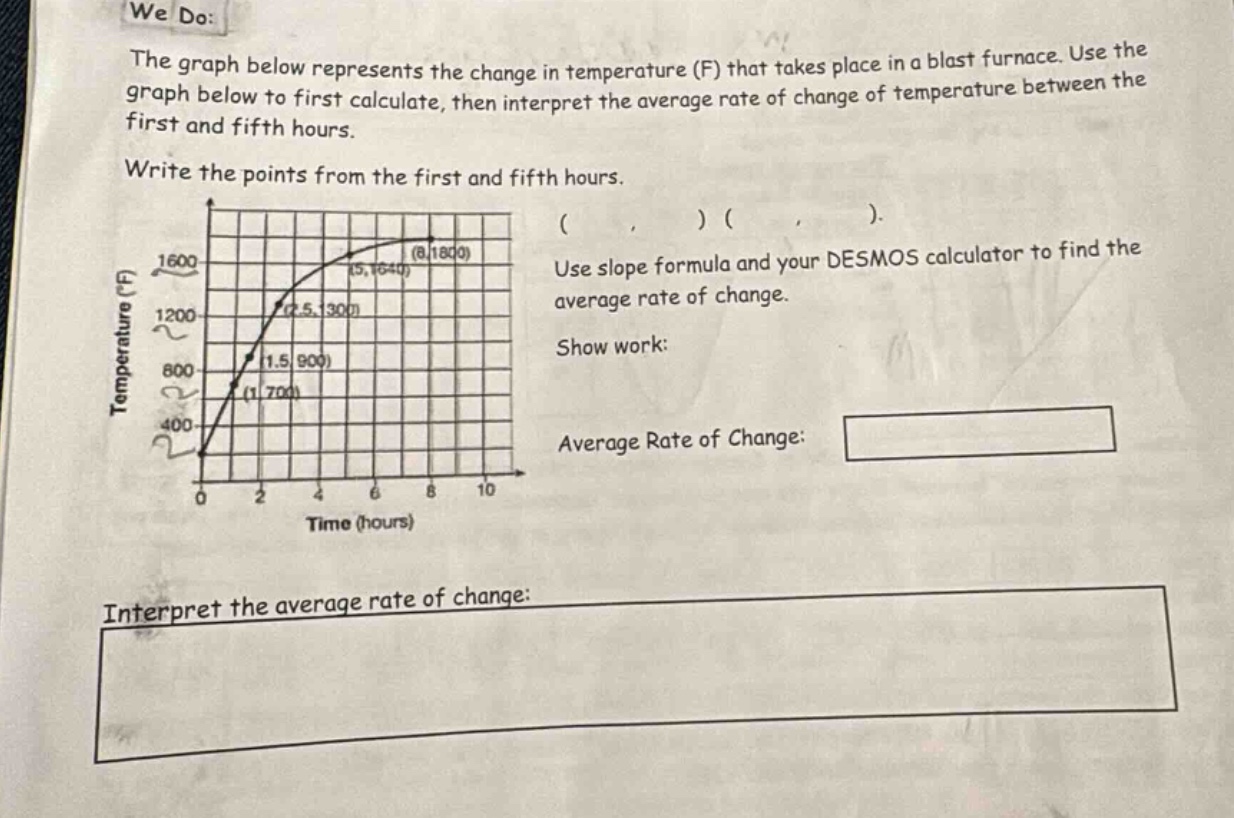
we do: the graph below represents the change in temperature (f) that takes place in a blast furnace. use the graph below to first calculate, then interpret the average rate of change of temperature between the first and fifth hours. write the points from the first and fifth hours. ( ) ( ). use slope formula and your desmos calculator to find the average rate of change. show work: average rate of change: interpret the average rate of change:
Answer
Explanation:
Step1: Identify the two - point coordinates
The point at the first hour is $(1,700)$ and the point at the fifth hour is $(5,1640)$.
Step2: Recall the slope formula
The slope formula for the average rate of change between two points $(x_1,y_1)$ and $(x_2,y_2)$ is $m=\frac{y_2 - y_1}{x_2 - x_1}$. Here, $x_1 = 1,y_1=700,x_2 = 5,y_2 = 1640$.
Step3: Calculate the average rate of change
$m=\frac{1640 - 700}{5 - 1}=\frac{940}{4}=235$.
Answer:
The points are $(1,700)$ and $(5,1640)$. The average rate of change is $235$. This means that, on average, the temperature in the blast - furnace increases by $235$ degrees Fahrenheit per hour between the first and fifth hours.