wyatt throws a ball up in the air. the graph below shows the height of the ball h in feet after t seconds…
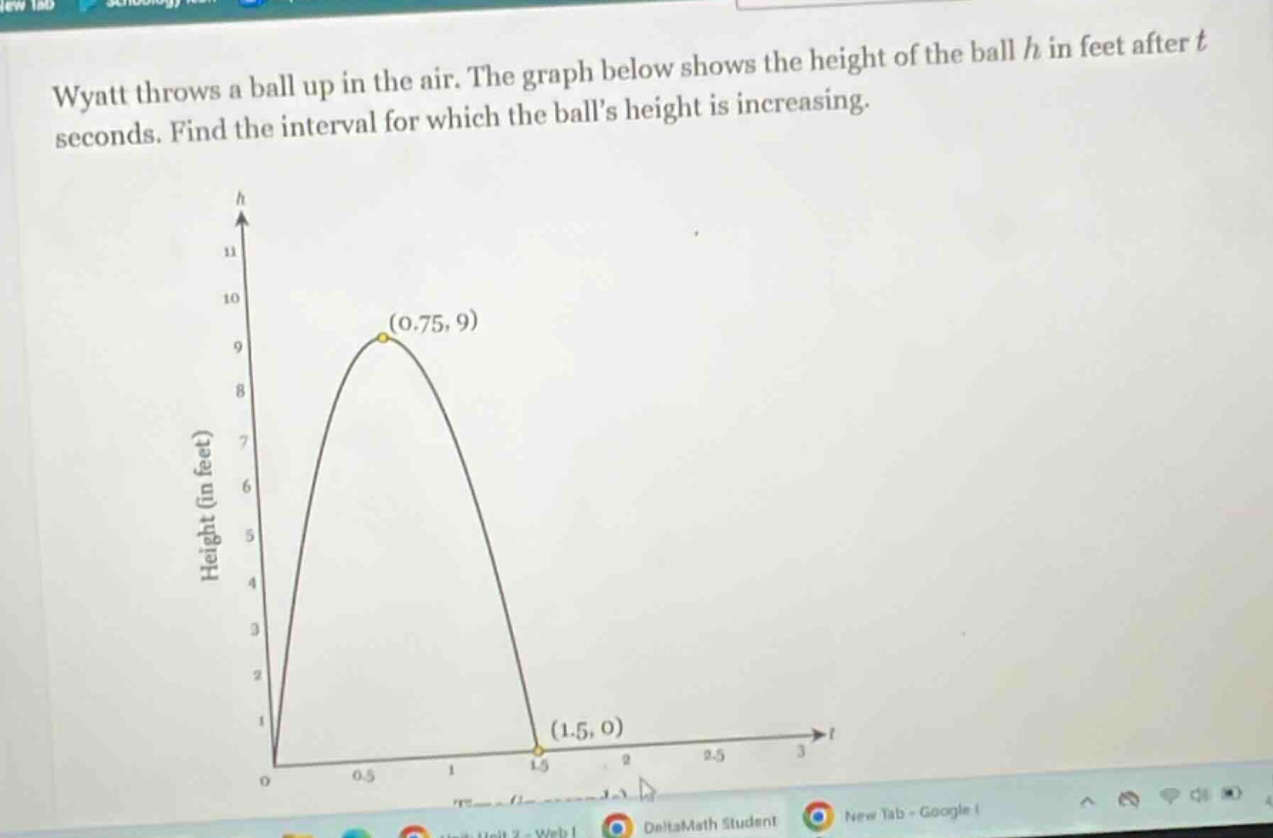
wyatt throws a ball up in the air. the graph below shows the height of the ball h in feet after t seconds. find the interval for which the balls height is increasing.
Answer
Answer:
$0\leq t<0.75$
Explanation:
Step1: Comprender la gráfica
La gráfica muestra la altura $h$ en función del tiempo $t$.
Step2: Identificar el punto de máximo
El punto $(0.75,9)$ es el máximo de la gráfica.
Step3: Determinar el intervalo creciente
Antes del máximo, la función está creciendo. Entonces, el intervalo es $0\leq t<0.75$.