comparing relationships in a table\nacidity changes after dry ice is added\nwhat happens to the acidity of…
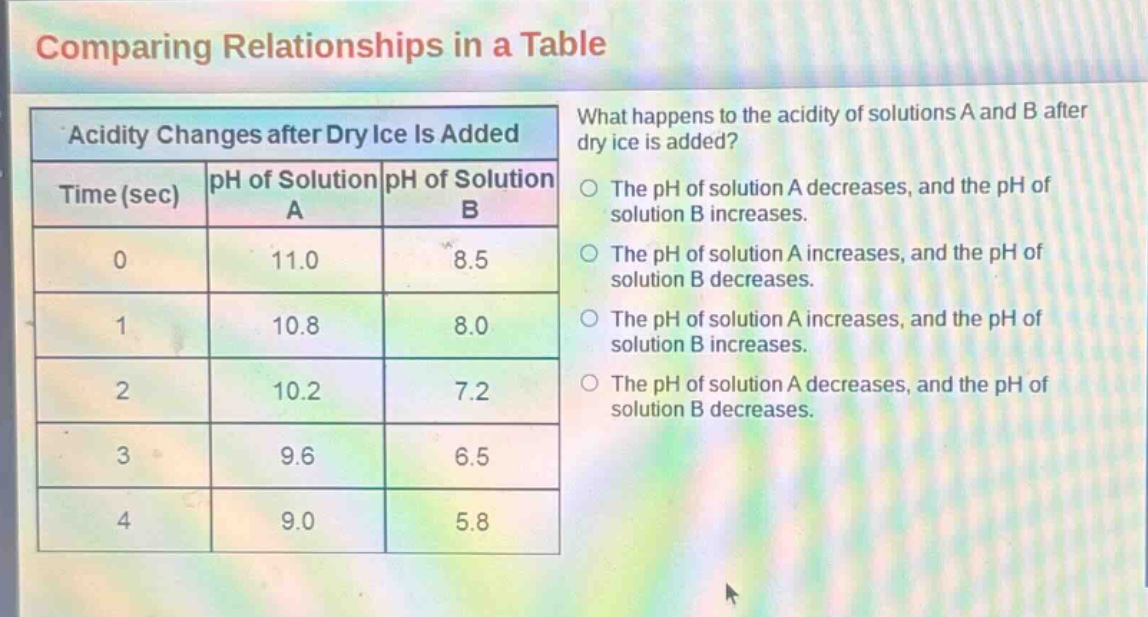
comparing relationships in a table\nacidity changes after dry ice is added\nwhat happens to the acidity of solutions a and b after dry ice is added?\ntime (sec) | ph of solution a | ph of solution b\n0 | 11.0 | 8.5\n1 | 10.8 | 8.0\n2 | 10.2 | 7.2\n3 | 9.6 | 6.5\n4 | 9.0 | 5.8\nthe ph of solution a decreases, and the ph of solution b increases.\nthe ph of solution a increases, and the ph of solution b decreases.\nthe ph of solution a increases, and the ph of solution b increases.\nthe ph of solution a decreases, and the ph of solution b decreases.
Answer
Explanation:
Step1: Analyze solution A's pH change
As time goes from 0 - 4 seconds, pH of solution A changes from 11.0 to 9.0. Since a lower pH indicates higher acidity and the pH is decreasing, acidity of solution A increases.
Step2: Analyze solution B's pH change
As time goes from 0 - 4 seconds, pH of solution B changes from 8.5 to 5.8. Since a lower pH indicates higher acidity and the pH is decreasing, acidity of solution B increases.
Answer:
The pH of solution A decreases, and the pH of solution B decreases.