drag the correct scales and labels to the correct location on the graph. a scientist has a chemical sample…
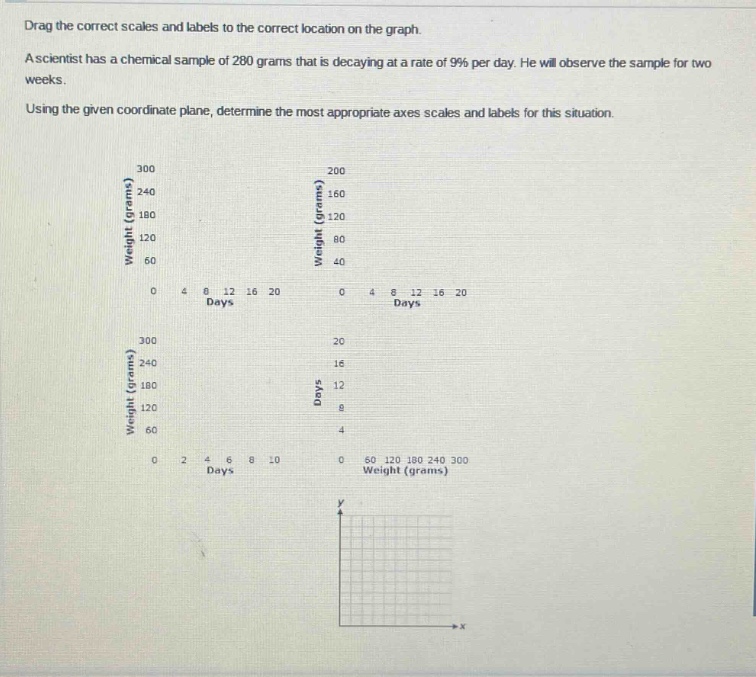
drag the correct scales and labels to the correct location on the graph. a scientist has a chemical sample of 280 grams that is decaying at a rate of 9% per day. he will observe the sample for two weeks. using the given coordinate plane, determine the most appropriate axes scales and labels for this situation.
Answer
Brief Explanations:
The problem asks to determine the appropriate scales and labels for a graph representing the decay of a chemical sample over time.
- Identify Variables: The independent variable is time, measured in days. The dependent variable is the weight of the sample, measured in grams. Conventionally, the independent variable is plotted on the x-axis and the dependent variable on the y-axis.
- Determine Axis Ranges:
- Time (x-axis): The observation period is two weeks, which is 14 days. The x-axis should start at 0 and extend to at least 14 days. A range like 0 to 16 or 0 to 20 days would be appropriate.
- Weight (y-axis): The initial weight is 280 grams. The weight decreases over time but remains positive. The y-axis should start at 0 and extend to at least 280 grams. A range like 0 to 300 grams would be appropriate.
- Evaluate Options: Compare the required ranges and labels with the provided options.
- The top-left graph has the x-axis labeled "Days" scaled from 0 to 20, and the y-axis labeled "Weight (grams)" scaled from 0 to 300. This setup correctly places the variables on the appropriate axes and covers the necessary ranges for both time (0-14 days) and weight (0-280 grams).
- The other options are unsuitable because they either have incorrect ranges (top-right y-axis max is 200g; bottom-left x-axis max is 10 days) or incorrect axis assignments (bottom-right swaps the axes).
Answer:
The most appropriate axes scales and labels are: x-axis: Labeled "Days", scale from 0 to 20 with increments of 4. y-axis: Labeled "Weight (grams)", scale from 0 to 300 with increments of 60. (This corresponds to the top-left graph option).