2. gather data: use the gizmo to measure the solubility of potassium nitrate at each temperature given in…
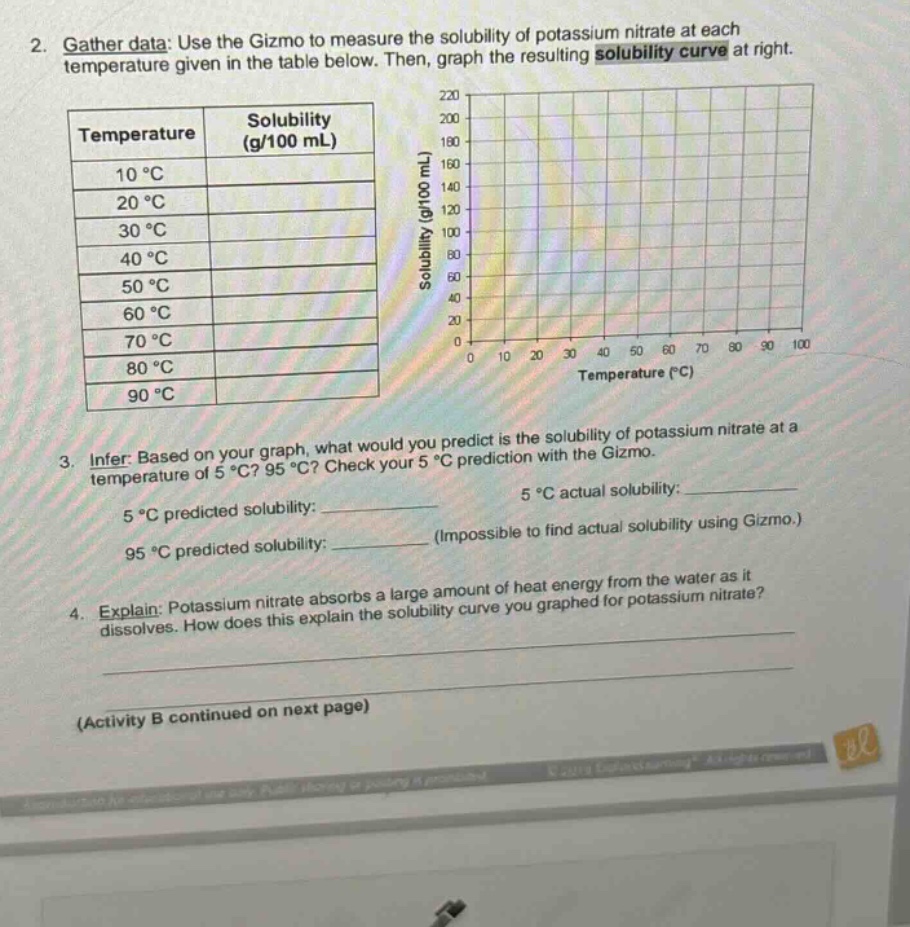
2. gather data: use the gizmo to measure the solubility of potassium nitrate at each temperature given in the table below. then, graph the resulting solubility curve at right.\n\n| temperature | solubility (g/100 ml) |\n| ---- | ---- |\n| 10 °c | |\n| 20 °c | |\n| 30 °c | |\n| 40 °c | |\n| 50 °c | |\n| 60 °c | |\n| 70 °c | |\n| 80 °c | |\n| 90 °c | |\n\n3. infer: based on your graph, what would you predict is the solubility of potassium nitrate at a temperature of 5 °c? 95 °c? check your 5 °c prediction with the gizmo.\n5 °c predicted solubility: ________ 5 °c actual solubility: ________\n95 °c predicted solubility: ________ (impossible to find actual solubility using gizmo.)\n\n4. explain: potassium nitrate absorbs a large amount of heat energy from the water as it dissolves. how does this explain the solubility curve you graphed for potassium nitrate?\n\n(activity b continued on next page)
Answer
Explanation:
Step1: Measure solubility values
Use the Gizmo to fill in the solubility - temperature table for potassium nitrate at 10°C, 20°C, …, 90°C. Then plot these points on the given graph to create the solubility curve.
Step2: Predict solubility at 5°C and 95°C
Extrapolate the solubility curve to estimate the solubility at 5°C and 95°C. For 5°C, look at the trend of the curve as it approaches lower temperatures. For 95°C, look at the trend as it approaches higher temperatures.
Step3: Explain the solubility curve
Since potassium nitrate absorbs heat (endothermic dissolution), according to Le - Chatelier's principle, increasing the temperature provides more heat for the dissolution process, thus increasing the solubility. As the temperature rises, more potassium nitrate can dissolve in water, which is reflected in the upward - sloping solubility curve.
Answer:
For 5°C predicted solubility: Extrapolate from the curve (value will vary depending on the curve shape). For 95°C predicted solubility: Extrapolate from the curve (value will vary depending on the curve shape). Explanation for solubility curve: As an endothermic substance, increasing temperature increases the solubility of potassium nitrate, resulting in an upward - sloping solubility curve.