a pure sample of substance s is put into an evacuated flask. the flask is then heated steadily and the…
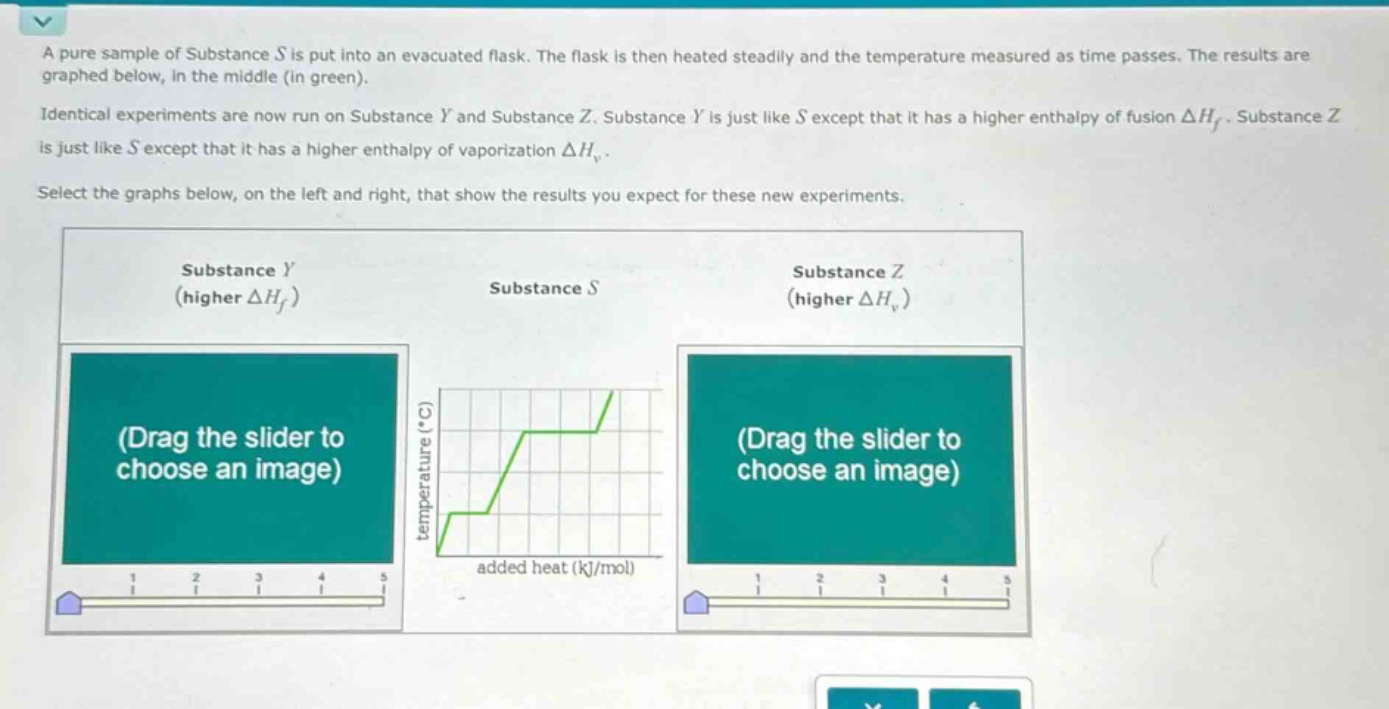
a pure sample of substance s is put into an evacuated flask. the flask is then heated steadily and the temperature measured as time passes. the results are graphed below, in the middle (in green).\nidentical experiments are now run on substance y and substance z. substance y is just like s except that it has a higher enthalpy of fusion δh_f. substance z is just like s except that it has a higher enthalpy of vaporization δh_v.\nselect the graphs below, on the left and right, that show the results you expect for these new experiments.\nsubstance y (higher δh_f)\nsubstance s\nsubstance z (higher δh_v)\n(drag the slider to choose an image)\n(drag the slider to choose an image)
Answer
Brief Explanations:
The provided graph is a heating curve, which plots temperature against the amount of heat added to a substance. The horizontal plateaus in the curve indicate phase transitions (melting and vaporization) occurring at constant temperatures. The length of these plateaus on the "added heat" axis is directly proportional to the enthalpy of the respective phase transition.
- The first plateau corresponds to melting (fusion), and its length represents the enthalpy of fusion ($\Delta H_f$).
- The second plateau corresponds to boiling (vaporization), and its length represents the enthalpy of vaporization ($\Delta H_v$).
For Substance Y (higher $\Delta H_f$): Substance Y is stated to be like Substance S but with a higher enthalpy of fusion ($\Delta H_f$). This means that more heat is required to melt Substance Y compared to Substance S. Consequently, on the heating curve for Substance Y:
- The first horizontal plateau (representing the solid-to-liquid phase transition, or melting) will be longer than the corresponding plateau for Substance S.
- All other features of the heating curve, including the melting temperature, boiling temperature, the length of the second plateau (enthalpy of vaporization), and the slopes of the segments where the temperature is rising (which correspond to the heat capacities of the solid, liquid, and gaseous phases), will remain the same as those for Substance S.
For Substance Z (higher $\Delta H_v$): Substance Z is stated to be like Substance S but with a higher enthalpy of vaporization ($\Delta H_v$). This means that more heat is required to vaporize Substance Z compared to Substance S. Consequently, on the heating curve for Substance Z:
- The second horizontal plateau (representing the liquid-to-gas phase transition, or vaporization) will be longer than the corresponding plateau for Substance S.
- All other features of the heating curve, including the melting temperature, boiling temperature, the length of the first plateau (enthalpy of fusion), and the slopes of the heating segments, will remain the same as those for Substance S.
Answer:
To select the correct graphs, you should look for the following characteristics:
For Substance Y (higher $\Delta H_f$): The correct graph for Substance Y should be identical to the graph for Substance S in all aspects (initial temperature, slopes of heating segments, melting temperature, boiling temperature, and length of the vaporization plateau), except that the first horizontal plateau (melting) should be longer than that in the graph for Substance S.
For Substance Z (higher $\Delta H_v$): The correct graph for Substance Z should be identical to the graph for Substance S in all aspects (initial temperature, slopes of heating segments, melting temperature, boiling temperature, and length of the fusion plateau), except that the second horizontal plateau (vaporization) should be longer than that in the graph for Substance S.