a pure solid sample of substance x is put into an evacuated flask. the flask is heated at a steady rate and…
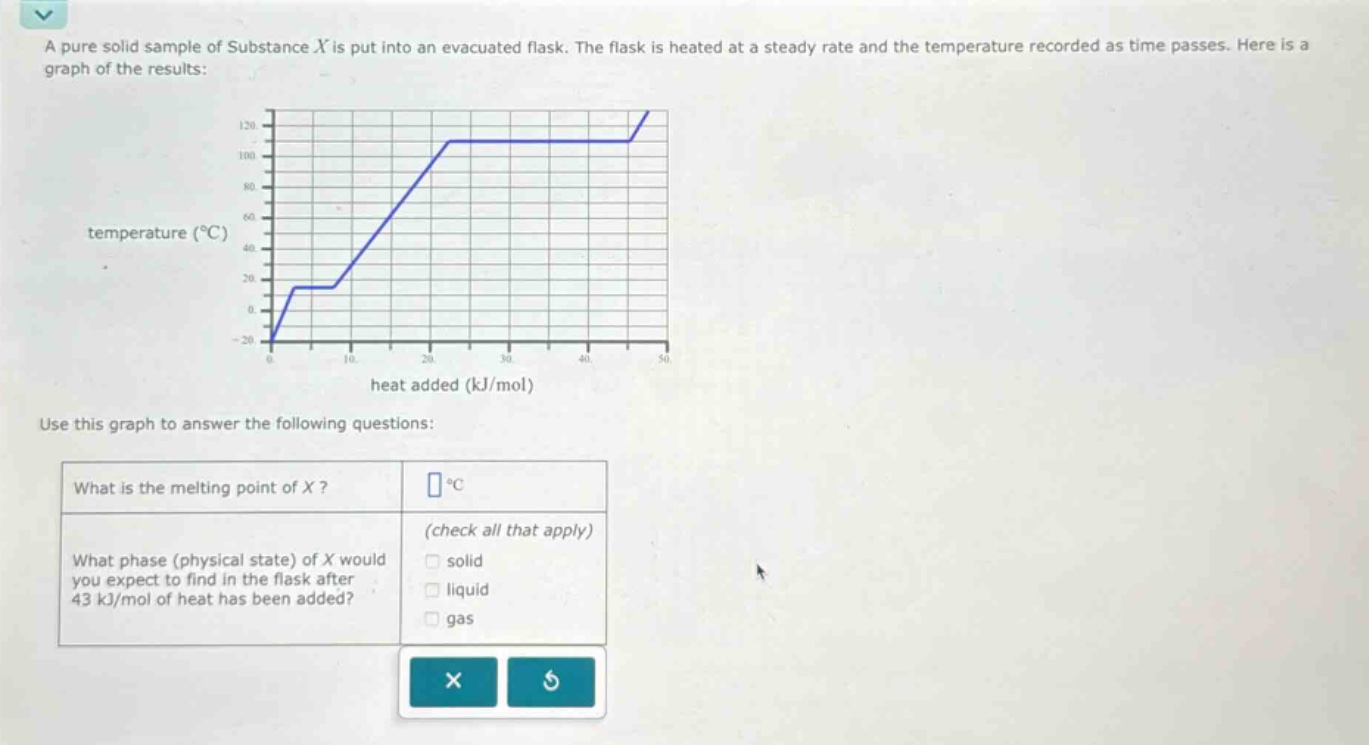
a pure solid sample of substance x is put into an evacuated flask. the flask is heated at a steady rate and the temperature recorded as time passes. here is a graph of the results: temperature (°c) heat added (kj/mol) use this graph to answer the following questions: what is the melting point of x? °c what phase (physical state) of x would you expect to find in the flask after 43 kj/mol of heat has been added? (check all that apply) solid liquid gas
Answer
Answer:
For "What is the melting point of X?": 20 °C
For "What phase (physical state) of X would you expect to find in the flask after 43 kJ/mol of heat has been added?": liquid gas
Explanation:
Part 1: What is the melting point of X?
Step1: Identify the melting phase on the graph.
The melting point is the temperature at which a solid substance changes to a liquid. On a heating curve, this is represented by the first horizontal plateau where temperature remains constant despite heat being added.
Step2: Determine the temperature of the melting phase.
From the graph, the first plateau occurs at a constant temperature of $20 \text{ } ^\circ\text{C}$. Therefore, the melting point of substance X is $20 \text{ } ^\circ\text{C}$.
Part 2: What phase (physical state) of X would you expect to find in the flask after 43 kJ/mol of heat has been added?
Step1: Locate 43 kJ/mol on the x-axis.
Find the point corresponding to $43 \text{ kJ/mol}$ of heat added on the horizontal axis of the graph.
Step2: Identify the corresponding region on the heating curve.
At $43 \text{ kJ/mol}$ of heat added, the graph shows that the substance is on the second horizontal plateau. This plateau starts at approximately $30 \text{ kJ/mol}$ and ends at approximately $45 \text{ kJ/mol}$.
Step3: Determine the phase(s) at this point.
The second horizontal plateau on a heating curve represents the boiling phase, where the substance transitions from liquid to gas. During this phase transition, both liquid and gas phases coexist. Thus, after $43 \text{ kJ/mol}$ of heat has been added, substance X would be present in both liquid and gas phases.