ajay analyzed two companies and has formulated tables to model each companys growth, where x represents the…
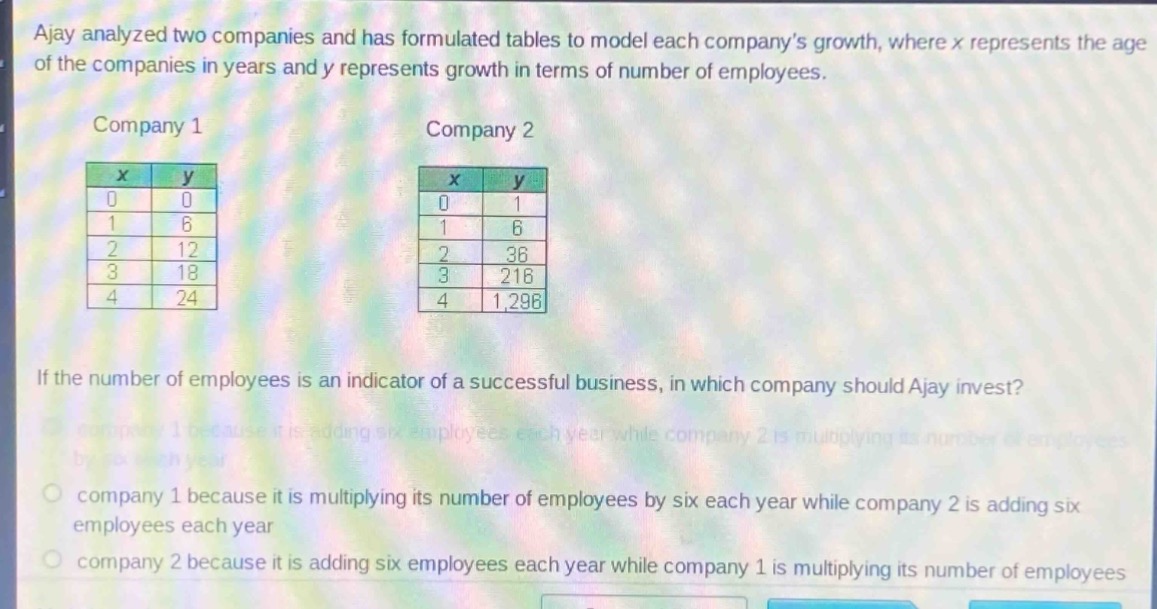
ajay analyzed two companies and has formulated tables to model each companys growth, where x represents the age of the companies in years and y represents growth in terms of number of employees.\n\ncompany 1\n| x | y |\n|----|----|\n| 0 | 0 |\n| 1 | 6 |\n| 2 | 12 |\n| 3 | 18 |\n| 4 | 24 |\n\ncompany 2\n| x | y |\n|----|----|\n| 0 | 1 |\n| 1 | 6 |\n| 2 | 36 |\n| 3 | 216 |\n| 4 | 1,296 |\n\nif the number of employees is an indicator of a successful business, in which company should ajay invest?\ncompany 1 because it is adding six employees each year while company 2 is multiplying its number of employees by six each year\ncompany 1 because it is multiplying its number of employees by six each year while company 2 is adding six employees each year\ncompany 2 because it is adding six employees each year while company 1 is multiplying its number of employees
Answer
Explanation:
Step1: Analyze Company 1's growth pattern
Company 1 has the following data points: when (x = 0,y=0); when (x = 1,y = 6); when (x=2,y = 12); when (x = 3,y=18); when (x=4,y = 24). The difference in (y) - values for a unit - increase in (x) is constant. (6-0=12 - 6=18 - 12=24 - 18 = 6). So, the growth of Company 1 is linear and can be modeled by the equation (y=6x).
Step2: Analyze Company 2's growth pattern
Company 2 has the following data points: when (x = 0,y = 1); when (x=1,y = 6); when (x = 2,y=36); when (x=3,y = 216); when (x=4,y=1296). We can see that (\frac{6}{1}=6), (\frac{36}{6}=6), (\frac{216}{36}=6), (\frac{1296}{216}=6). The growth of Company 2 is exponential and can be modeled by the equation (y = 6^{x}).
Step3: Compare the growth for larger values of (x)
As (x) (number of years) increases, exponential growth ((y = 6^{x})) outpaces linear growth ((y=6x)). For example, when (x = 5), for Company 1, (y=6\times5=30), and for Company 2, (y=6^{5}=7776).
Answer:
Company 2 because its number of employees is growing exponentially (multiplying by 6 each year) while Company 1's number of employees is growing linearly (adding 6 each year).