when akbars son was four years old, akbar put $250 into an account that guaranteed a 10% annual return. the…
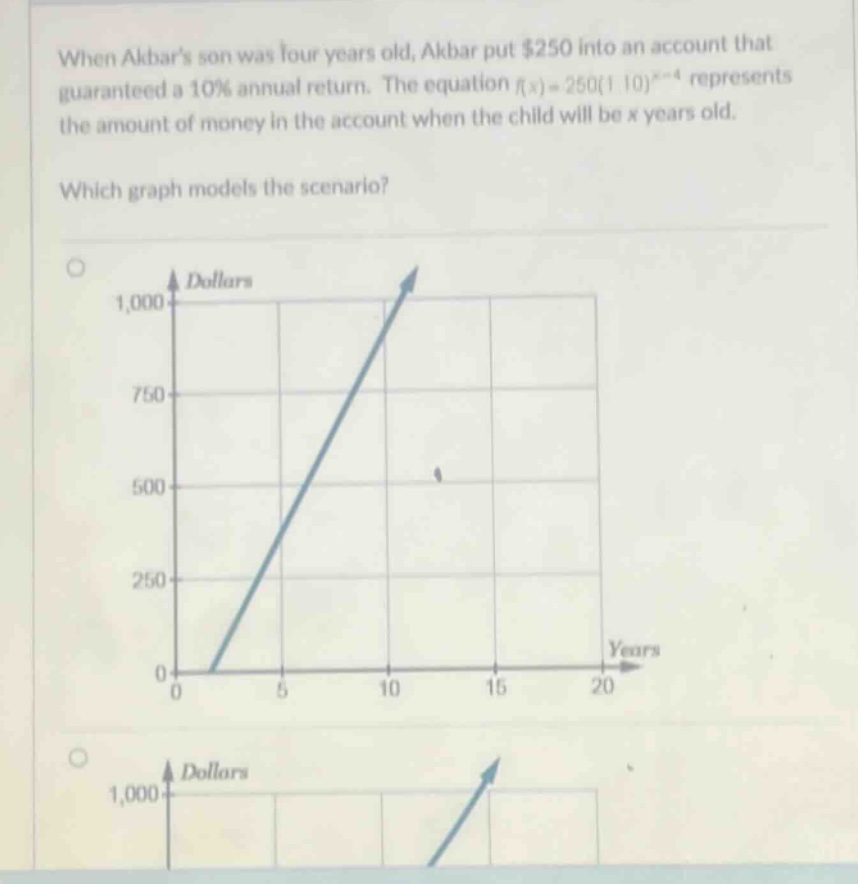
when akbars son was four years old, akbar put $250 into an account that guaranteed a 10% annual return. the equation f(x)=250(1.10)^(x - 4) represents the amount of money in the account when the child will be x years old. which graph models the scenario?
Answer
Explanation:
Step1: Analyze the function type
The function $f(x)=250(1.1)^{x - 4}$ is an exponential - growth function of the form $y = a\cdot b^{x - h}$ where $a = 250$, $b=1.1>1$, and $h = 4$.
Step2: Find the initial - value condition
When $x = 4$, $f(4)=250(1.1)^{4 - 4}=250(1.1)^{0}=250$. This means when the child is 4 years old, the amount of money in the account is $250$.
Step3: Check the growth rate
Since $b = 1.1$, the function is increasing. As $x$ (age of the child) increases, the value of $f(x)$ (amount of money) will increase exponentially.
The correct graph should start at the point $(4,250)$ and increase exponentially. Without seeing all the options completely, but based on the above - mentioned characteristics:
Answer:
The graph that starts at the point $(4, 250)$ on the coordinate plane (where the $x$ - axis is age in years and the $y$ - axis is the amount of money in dollars) and shows exponential growth as $x$ increases.