when akbars son was four years old, akbar put $250 into an account that guaranteed a 10% annual return. the…
when akbars son was four years old, akbar put $250 into an account that guaranteed a 10% annual return. the equation $f(x)=250(1.10)^{x - 4}$ represents the amount of money in the account when the child will be x years old. which graph models the scenario?
Answer
Explanation:
Step1: Analyze the exponential - growth function
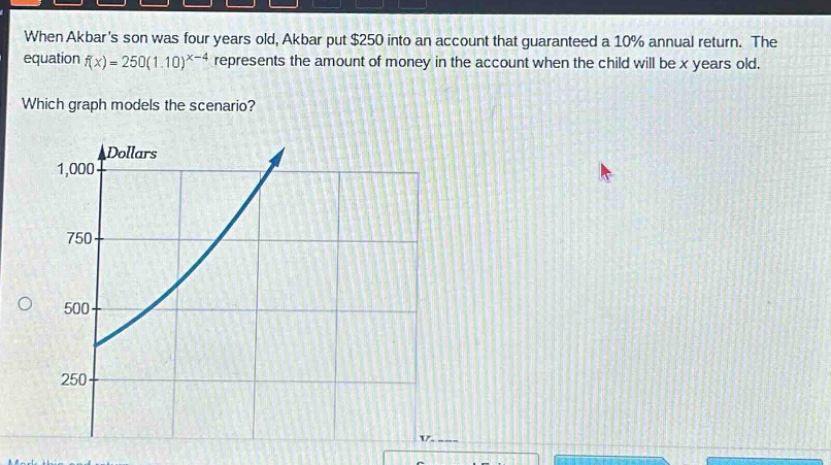
The function is $f(x)=250(1.10)^{x - 4}$, which is an exponential - growth function of the form $y = a(b)^{x - h}+k$ (in this case $a = 250$, $b=1.10$, $h = 4$, $k = 0$). When $x = 4$, $f(4)=250(1.10)^{4 - 4}=250(1.10)^{0}=250$.
Step2: Check the behavior as $x$ increases
As $x$ increases, since $b = 1.10>1$, the value of $(1.10)^{x - 4}$ increases, and so does $f(x)$. The graph starts at the point $(4,250)$ (when the child is 4 years old, the amount is $250$) and grows exponentially.
The graph that starts at the point $(4,250)$ on the $x - y$ plane (where $x$ is the age of the child and $y$ is the amount of money in dollars) and increases exponentially as $x$ increases models the scenario. But since no other graphs are provided for comparison, we can only describe the key features of the correct graph. If we assume the given graph starts at $x = 4$ with $y=250$ and has an upward - sloping exponential shape, it is the correct one.
Answer:
The graph that starts at the point $(4, 250)$ and has an exponential growth pattern as $x$ (age of the child) increases.