the annual profits for a company are given in the following table, where x represents the number of years…
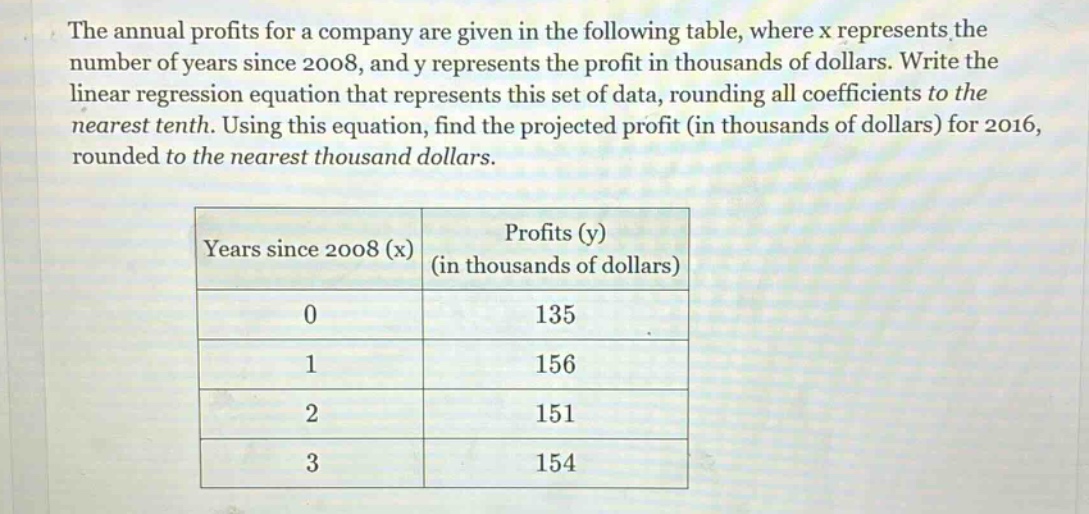
the annual profits for a company are given in the following table, where x represents the number of years since 2008, and y represents the profit in thousands of dollars. write the linear regression equation that represents this set of data, rounding all coefficients to the nearest tenth. using this equation, find the projected profit (in thousands of dollars) for 2016, rounded to the nearest thousand dollars.\n\n| years since 2008 (x) | profits (y) (in thousands of dollars) |\n| ---- | ---- |\n| 0 | 135 |\n| 1 | 156 |\n| 2 | 151 |\n| 3 | 154 |
Answer
Explanation:
Step1: Calculate the means of x and y
$n = 4$ $\bar{x}=\frac{0 + 1+2 + 3}{4}=\frac{6}{4}=1.5$ $\bar{y}=\frac{135 + 156+151+154}{4}=\frac{606}{4}=151.5$
Step2: Calculate the slope (m)
$\sum_{i = 1}^{n}(x_i-\bar{x})(y_i - \bar{y})=(0 - 1.5)(135-151.5)+(1 - 1.5)(156 - 151.5)+(2 - 1.5)(151-151.5)+(3 - 1.5)(154 - 151.5)$ $=(-1.5)(-16.5)+(-0.5)(4.5)+(0.5)(-0.5)+(1.5)(2.5)$ $=24.75-2.25 - 0.25+3.75=26$
$\sum_{i = 1}^{n}(x_i-\bar{x})^2=(0 - 1.5)^2+(1 - 1.5)^2+(2 - 1.5)^2+(3 - 1.5)^2$ $=2.25 + 0.25+0.25 + 2.25=5$
$m=\frac{\sum_{i = 1}^{n}(x_i-\bar{x})(y_i - \bar{y})}{\sum_{i = 1}^{n}(x_i-\bar{x})^2}=\frac{26}{5}=5.2$
Step3: Calculate the y - intercept (b)
$b=\bar{y}-m\bar{x}=151.5-5.2\times1.5=151.5 - 7.8 = 143.7$
The linear regression equation is $y = 5.2x+143.7$
Step4: Find x for 2016
For 2016, $x=2016 - 2008=8$
Step5: Calculate the projected profit
$y=5.2\times8 + 143.7=41.6+143.7=185.3\approx185$
Answer:
The linear regression equation is $y = 5.2x+143.7$. The projected profit for 2016 is 185 thousand dollars.