bolivia, labor force by occupation, 2010■agriculture■industry■serviceswhat does the graph indicate about…
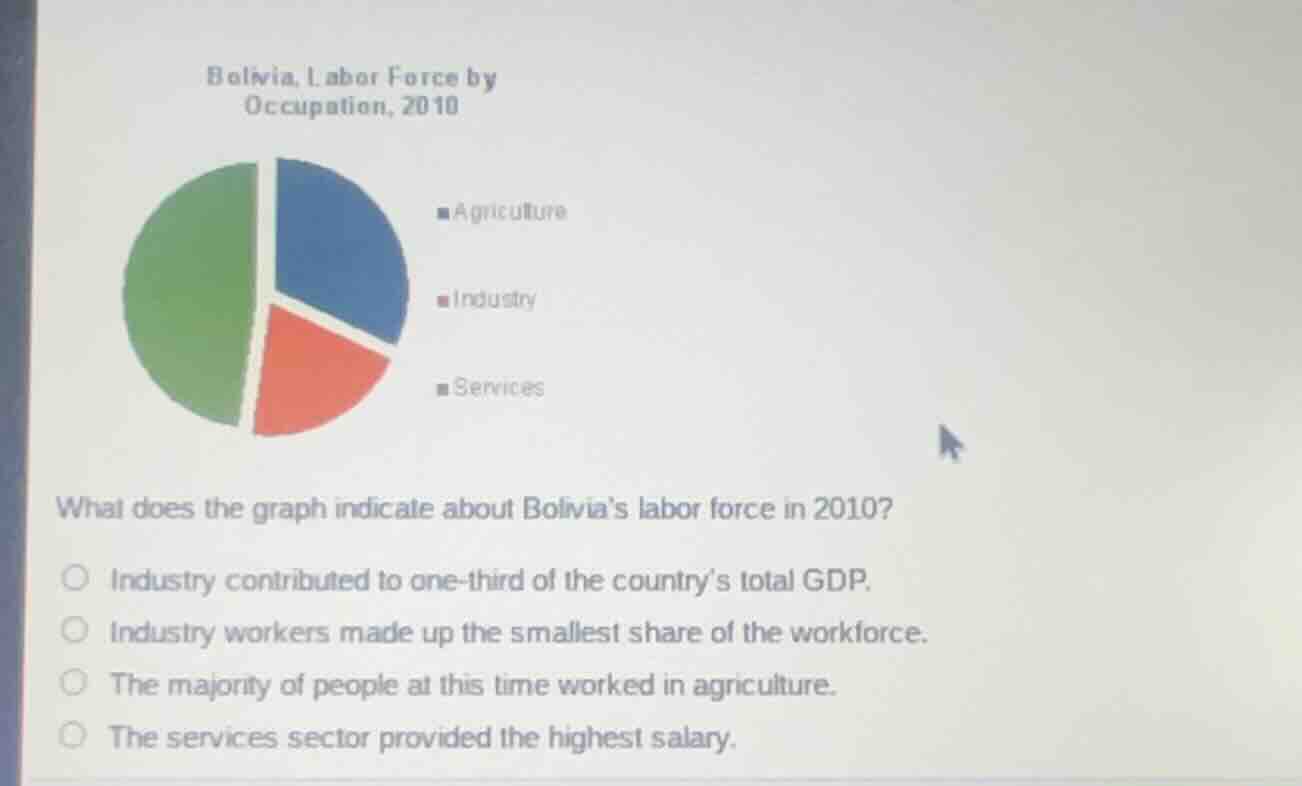
bolivia, labor force by occupation, 2010■agriculture■industry■serviceswhat does the graph indicate about bolivias labor force in 2010?○ industry contributed to one-third of the countrys total gdp.○ industry workers made up the smallest share of the workforce.○ the majority of people at this time worked in agriculture.○ the services sector provided the highest salary.
Answer
Brief Explanations:
- The pie chart only shows labor force distribution by occupation, not GDP contribution, so the first option is irrelevant.
- Visually, the Industry (red) slice is the smallest of the three, making this statement accurate.
- The Services (green) slice is the largest, not Agriculture (blue), so this statement is false.
- The chart provides no data on salaries, so the fourth option is unsupported.
Answer:
Industry workers made up the smallest share of the workforce.