the chart compares the price of graphic t-shirts to the quantity demanded.\ndemand schedule\nprice per…
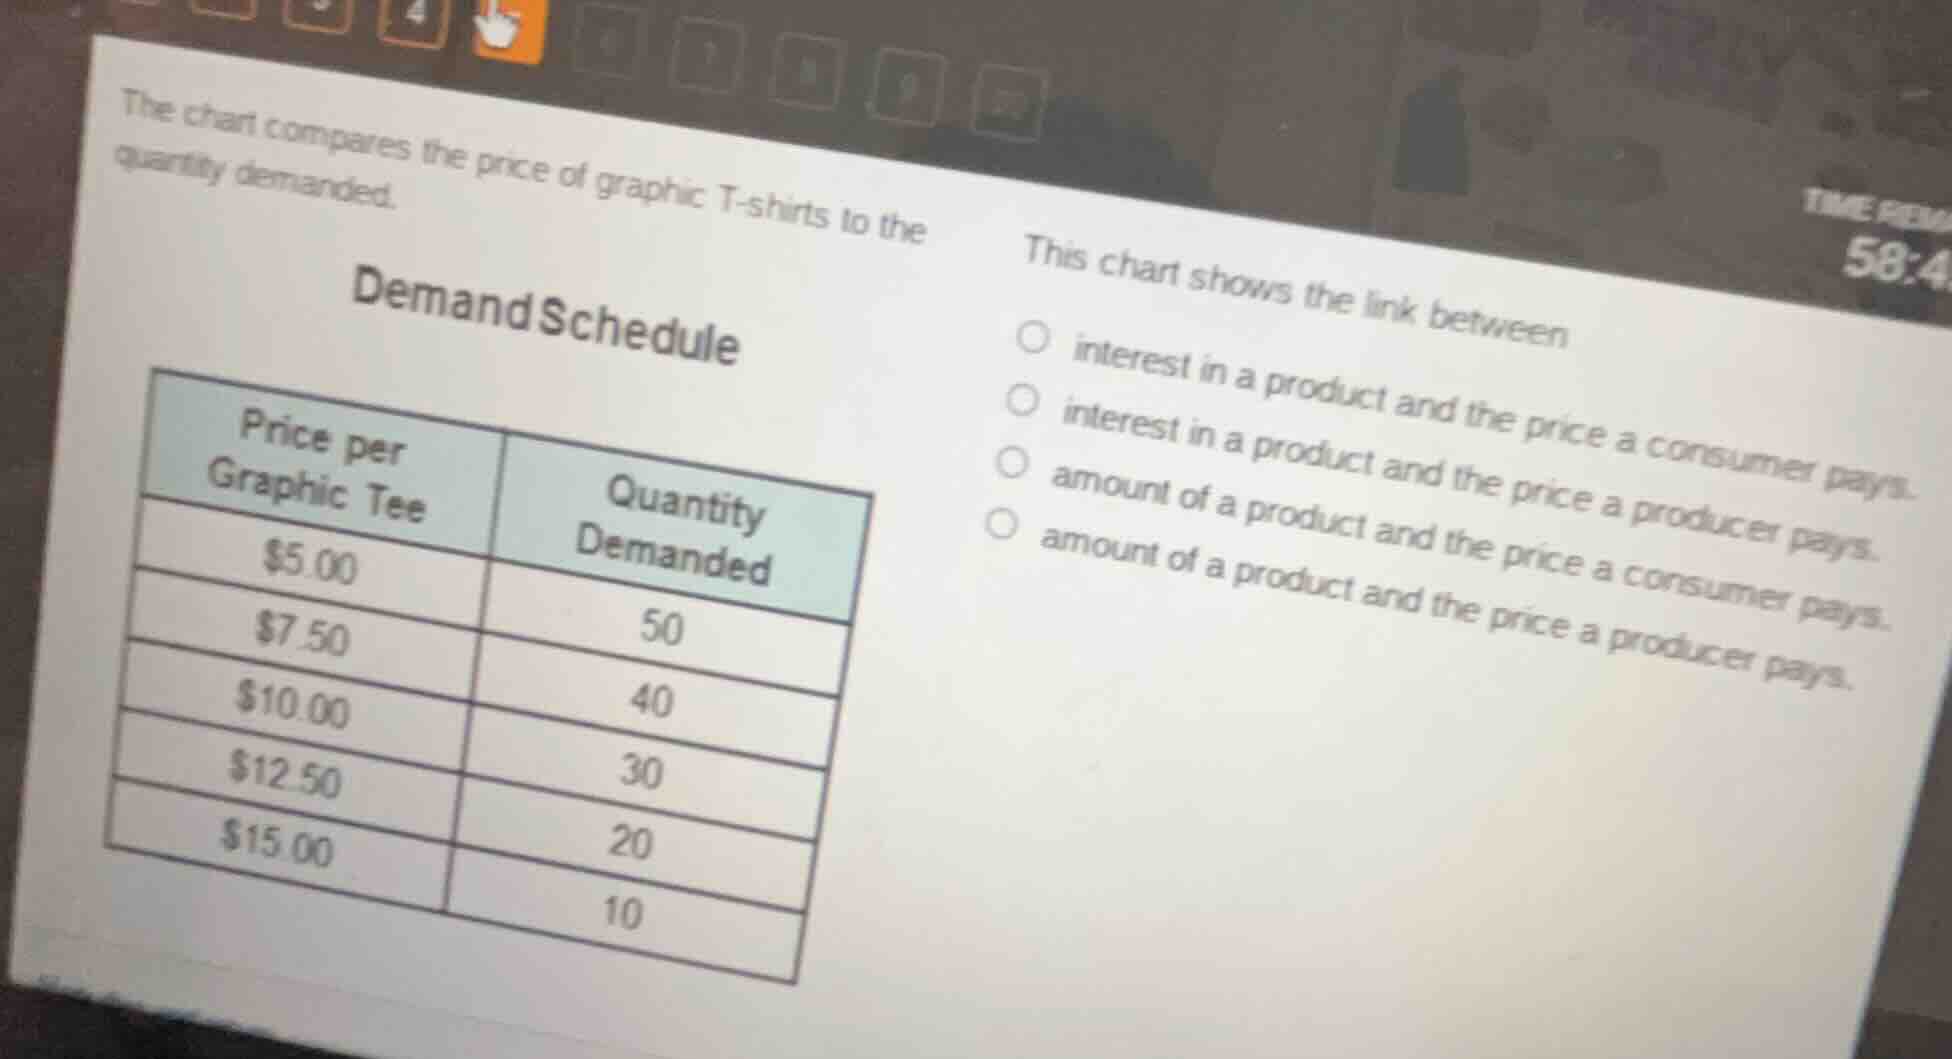
the chart compares the price of graphic t-shirts to the quantity demanded.\ndemand schedule\nprice per graphic tee | quantity demanded\n$5.00 | 50\n$7.50 | 40\n$10.00 | 30\n$12.50 | 20\n$15.00 | 10\n\nthis chart shows the link between\n○ interest in a product and the price a consumer pays.\n○ interest in a product and the price a producer pays.\n○ amount of a product and the price a consumer pays.\n○ amount of a product and the price a producer pays.
Answer
Brief Explanations:
A demand schedule illustrates the relationship between the price of a good (what a consumer pays) and the quantity of that good consumers are willing/able to buy (the amount of the product). The table shows how the quantity of graphic tees demanded changes with the price consumers pay, matching this definition. The other options are incorrect: it does not measure "interest" (a subjective measure, not quantity) and does not relate to what producers pay.
Answer:
○ amount of a product and the price a consumer pays.