the chart below shows an exchange rate table. which statement accurately interprets the information on the…
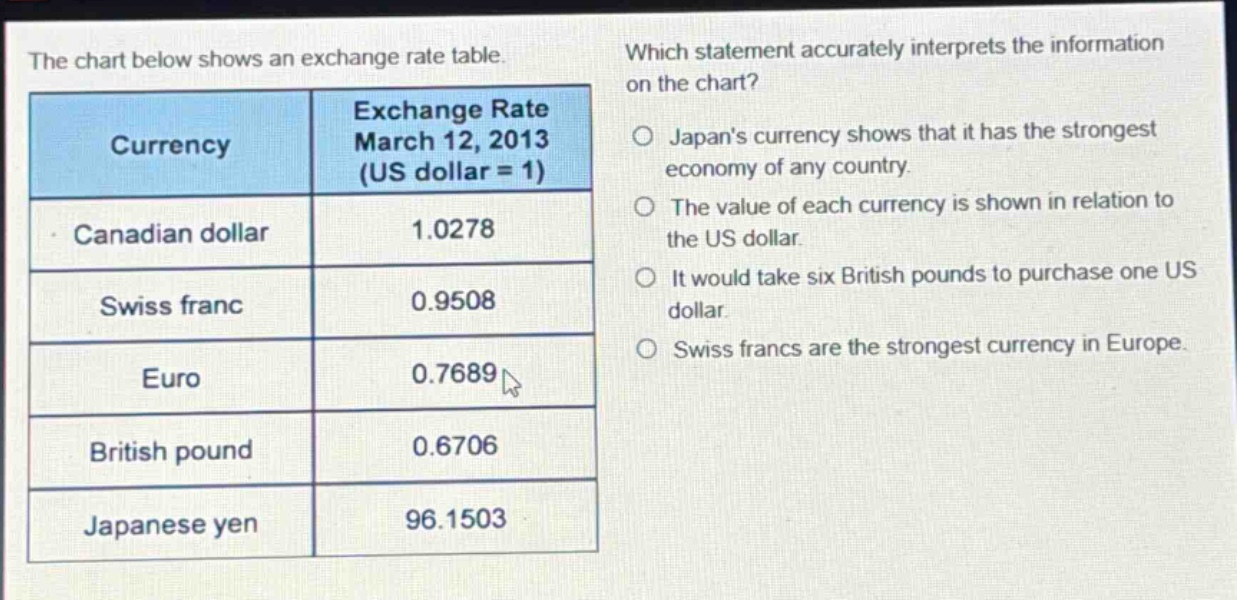
the chart below shows an exchange rate table. which statement accurately interprets the information on the chart? exchange rate march 12, 2013 (us dollar = 1) currency canadian dollar 1.0278 swiss franc 0.9508 euro 0.7689 british pound 0.6706 japanese yen 96.1503 japans currency shows that it has the strongest economy of any country. the value of each currency is shown in relation to the us dollar. it would take six british pounds to purchase one us dollar. swiss francs are the strongest currency in europe.
Answer
Brief Explanations:
The table clearly states that the exchange - rate values are given with the US dollar as 1. This means the value of each currency is shown in relation to the US dollar. The strength of an economy cannot be determined solely by currency exchange rates. Also, the table shows it takes 0.6706 British pounds to buy one US dollar, not six. And there is no information in the table to claim Swiss francs are the strongest in Europe.
Answer:
The value of each currency is shown in relation to the US dollar.