a company made a change in its advertising. suppose the companys monthly revenue (in thousands of dollars) x…
a company made a change in its advertising. suppose the companys monthly revenue (in thousands of dollars) x months after the change can be modeled with an exponential function. the graph of this function is shown below. use the model to answer the parts to the right. (a) what is the y - intercept of this graph? the y - intercept represents the (choose one) (b) for the first 10 months, as time increases, the monthly revenue (choose one) (c) give the equation of the asymptote. y = choose the statement that best describes the meaning of the asymptote. the company will only stay in business for 20 months. the companys monthly revenue does not rise above 200 thousand dollars per month. the companys monthly revenue does not fall below 50 thousand dollars per month.
Answer
Explanation:
Step1: Identify y - intercept
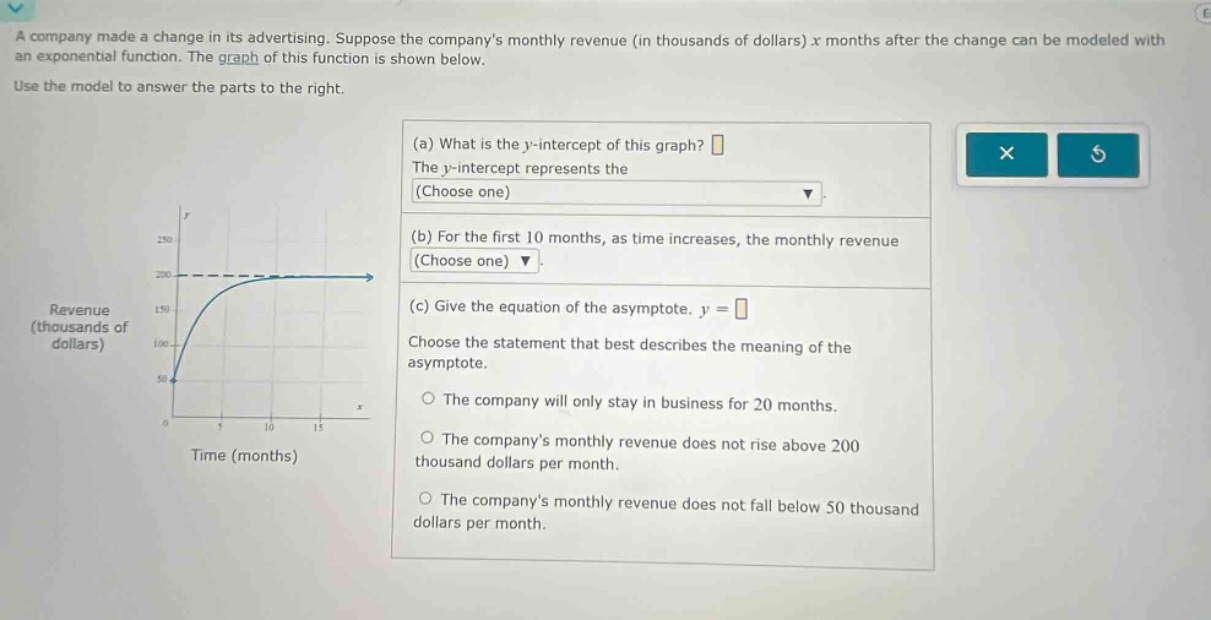
The y - intercept is the value of y when x = 0. From the graph, when x = 0, y = 50. It represents the company's monthly revenue (in thousands of dollars) right before the advertising change.
Step2: Analyze revenue trend
For the first 10 months, as x (time in months) increases, we can see from the graph that the y - value (monthly revenue) is increasing.
Step3: Determine asymptote
The horizontal asymptote of the graph is y = 200. This means the company's monthly revenue does not rise above 200 thousand dollars per month.
Answer:
(a) 50; the company's monthly revenue right before the advertising change (b) increases (c) 200; The company's monthly revenue does not rise above 200 thousand dollars per month.