consider the market for gasoline illustrated in the figure. suppose the market is perfectly competitive and…
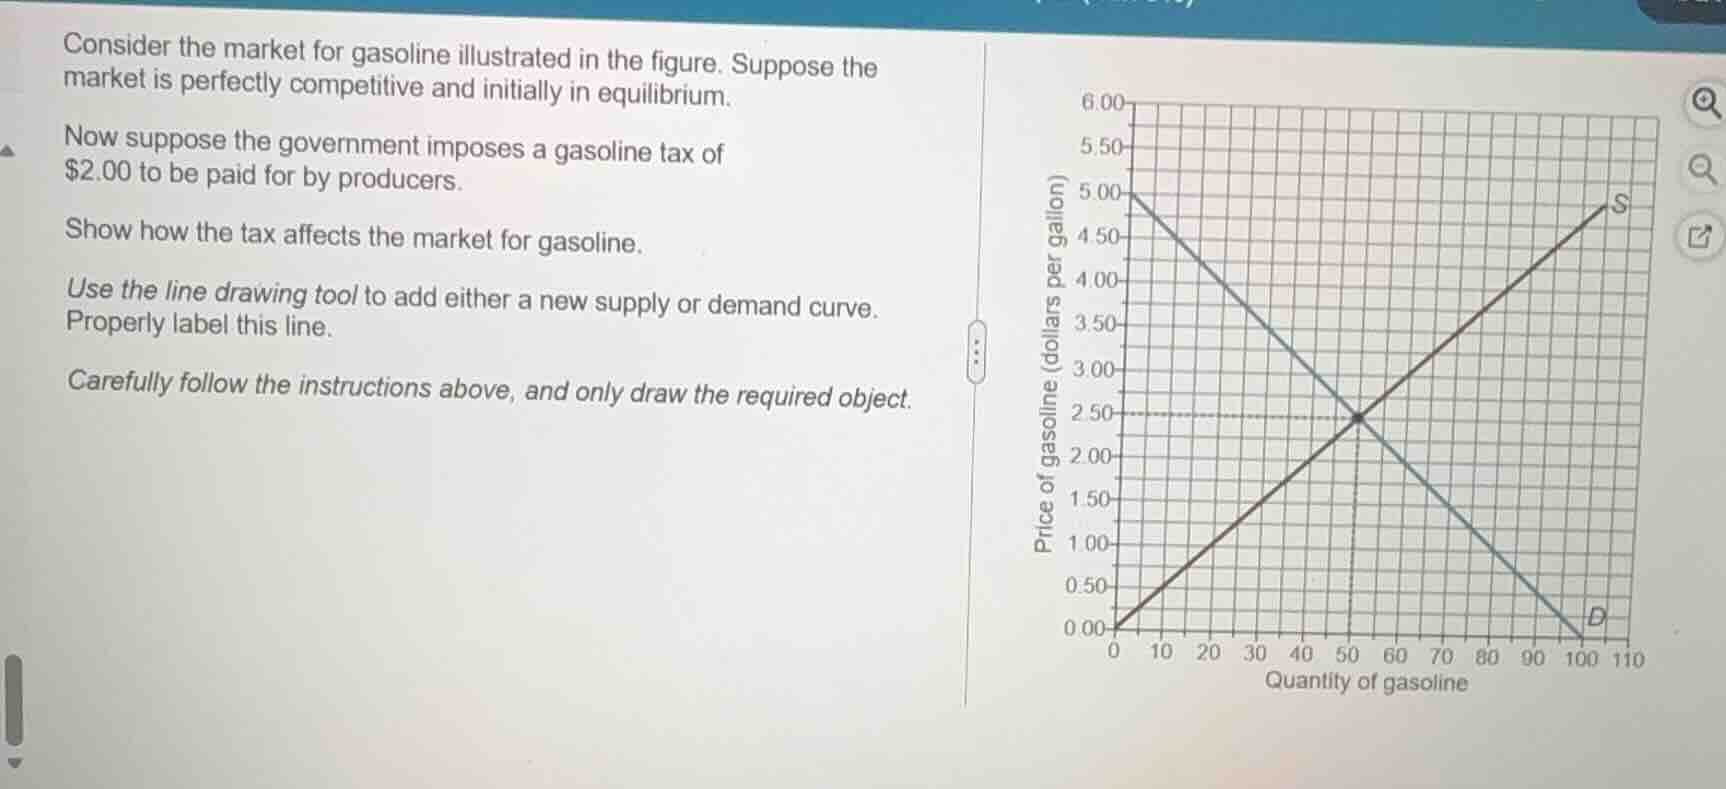
consider the market for gasoline illustrated in the figure. suppose the market is perfectly competitive and initially in equilibrium.\nnow suppose the government imposes a gasoline tax of $2.00 to be paid for by producers.\nshow how the tax affects the market for gasoline.\nuse the line drawing tool to add either a new supply or demand curve.\nproperly label this line.\ncarefully follow the instructions above, and only draw the required object.
Answer
Explanation:
Step1: Identify tax impact on supply
A $2.00 tax on producers increases their costs, so the supply curve shifts upward vertically by the full amount of the tax ($2.00).
Step2: Determine new supply curve points
For any quantity, the new price on the supply curve is the original supply price plus $2.00. For example:
- At quantity 0: original supply price = $0.00, new price = $0.00 + $2.00 = $2.00
- At original equilibrium quantity 60: original supply price = $2.50, new price = $2.50 + $2.00 = $4.50 Draw a new line parallel to the original supply curve (S) passing through these points, labeled (S_{tax}).
Answer:
A new upward-shifted supply curve (labeled (S_{tax})) is drawn, parallel to the original supply curve (S), with every point on the new curve $2.00 higher than the corresponding point on the original supply curve. This curve shows that producers now require $2.00 more per gallon at every quantity to cover the tax cost.