the diagram shows revenue from federal income taxes. what does the diagram show about tax revenue? federal…
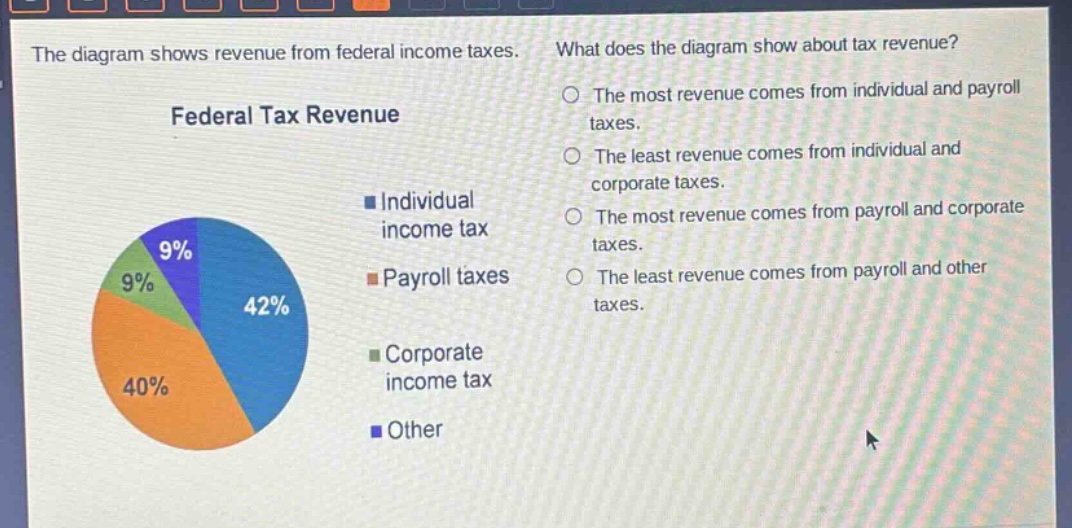
the diagram shows revenue from federal income taxes. what does the diagram show about tax revenue? federal tax revenue the most revenue comes from individual and payroll taxes. the least revenue comes from individual and corporate taxes. the most revenue comes from payroll and corporate taxes. the least revenue comes from payroll and other taxes. individual income tax payroll taxes corporate income tax other 9% 9% 42% 40%
Answer
Brief Explanations:
Analyze the pie - chart percentages. Individual income tax is 42%, payroll taxes is 40%, corporate income tax and other are 9% each. The largest slices are individual and payroll taxes.
Answer:
The most revenue comes from individual and payroll taxes.