the graph examines the market for graphic t-shirts.\nbased on the graph, which event could cause the change…
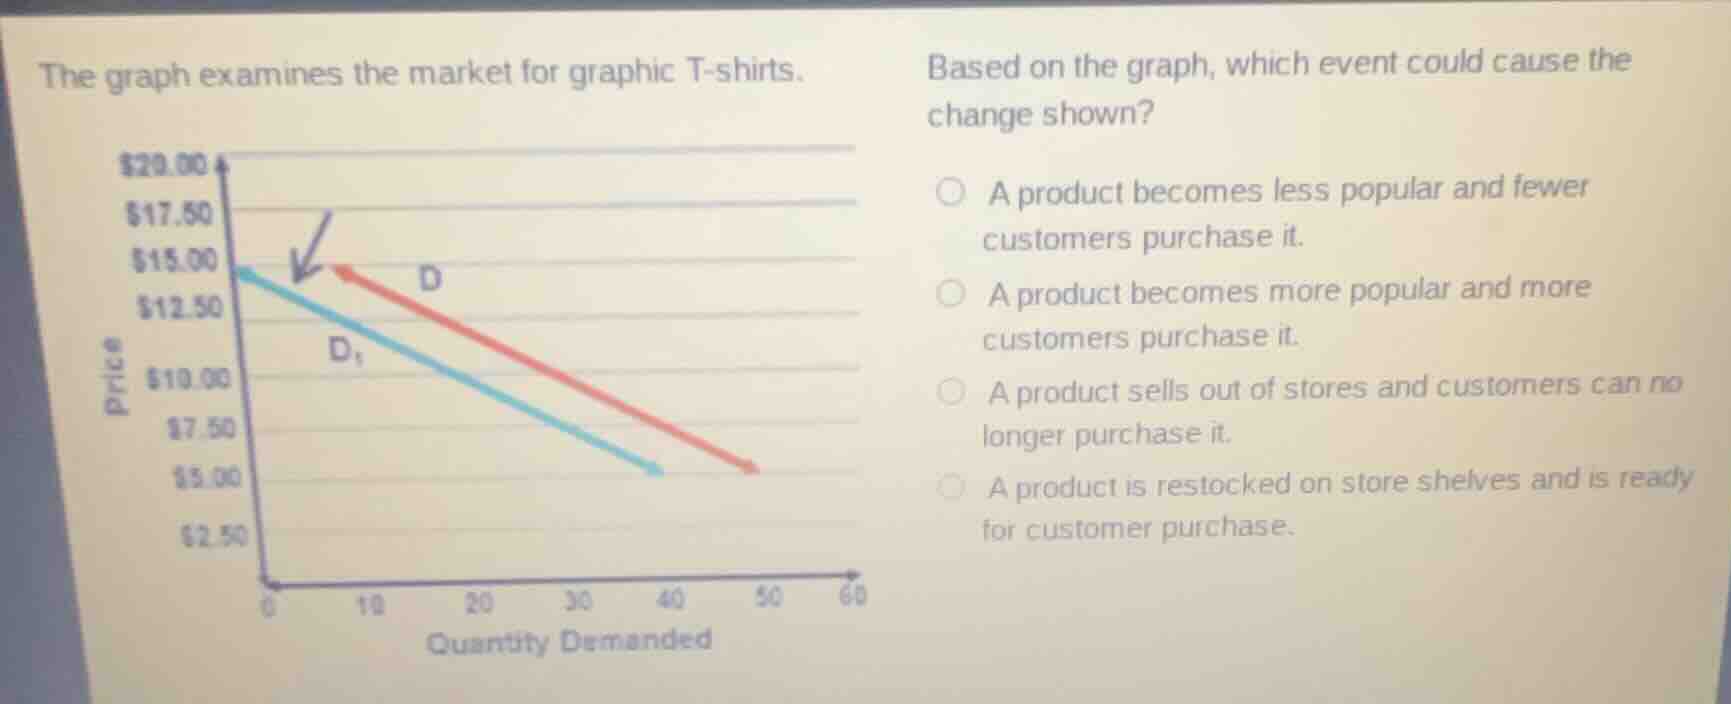
the graph examines the market for graphic t-shirts.\nbased on the graph, which event could cause the change shown?\na product becomes less popular and fewer customers purchase it.\na product becomes more popular and more customers purchase it.\na product sells out of stores and customers can no longer purchase it.\na product is restocked on store shelves and is ready for customer purchase.
Answer
Brief Explanations:
The graph shows a leftward shift of the demand curve (from D to D₁), which means demand for graphic T-shirts decreases at every price point. A leftward demand shift occurs when a product loses popularity, leading fewer customers to buy it. The other options either describe a rightward shift (increased popularity) or supply-side changes, which do not match the demand curve shift shown.
Answer:
A. A product becomes less popular and fewer customers purchase it.