on this graph, what does the green arrow represent?○ an ineffective price floor set above equilibrium…
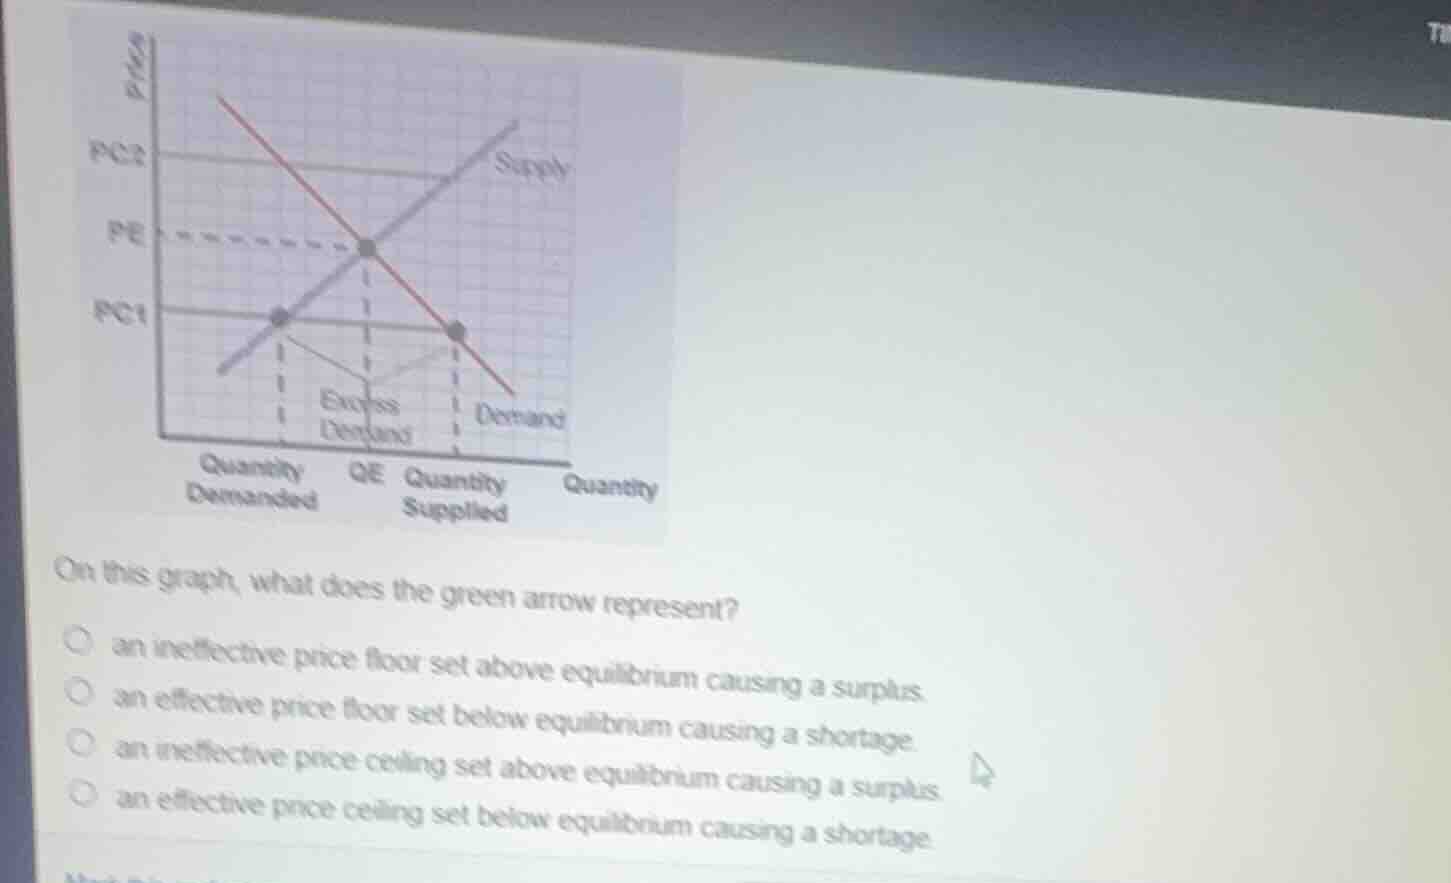
on this graph, what does the green arrow represent?○ an ineffective price floor set above equilibrium causing a surplus.○ an effective price floor set below equilibrium causing a shortage.○ an ineffective price ceiling set above equilibrium causing a surplus.○ an effective price ceiling set below equilibrium causing a shortage.
Answer
Brief Explanations:
- First, identify the price control: PC1 is below the equilibrium price PE, which is characteristic of a price ceiling (a maximum legal price).
- A price ceiling is effective when set below equilibrium, as it restricts the market from reaching the natural equilibrium.
- At price PC1, the quantity demanded (rightmost quantity) is greater than the quantity supplied (leftmost quantity), creating a shortage, labeled "Excess Demand" on the graph.
- Match this to the options: this describes an effective price ceiling set below equilibrium causing a shortage.
Answer:
an effective price ceiling set below equilibrium causing a shortage.