which graph could represent y, the amount owed on a car loan, as regular payments are made each month, x…
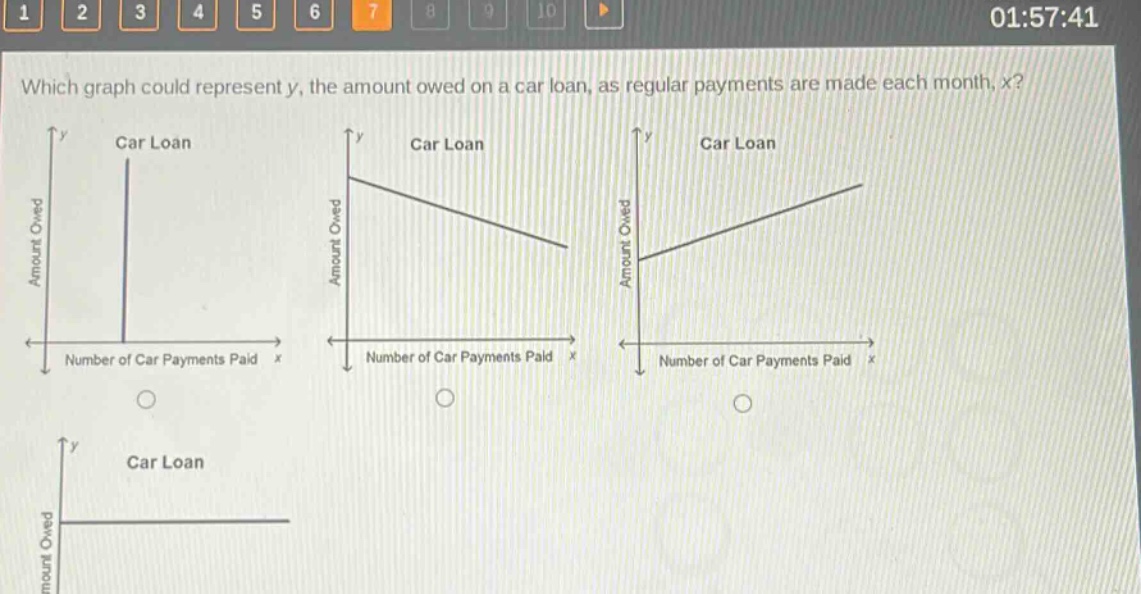
which graph could represent y, the amount owed on a car loan, as regular payments are made each month, x? car loan amount owed number of car payments paid x car loan amount owed number of car payments paid x car loan amount owed number of car payments paid x car loan amount owed
Answer
Answer:
The graph with a negative - slope line (the second graph from the left)
Explanation:
Step1: Analyze the relationship
As the number of car payments ($x$) increases, the amount owed on the car loan ($y$) decreases.
Step2: Match with graph features
A negative - slope line represents a decreasing relationship between $x$ and $y$. The first graph is a vertical line which is not applicable as it doesn't show a relationship with $x$. The third graph has a positive slope (amount owed increases as payments are made which is wrong). The fourth graph is a horizontal line (amount owed doesn't change with payments which is wrong). The second graph with a negative slope correctly shows that as the number of car payments made ($x$) increases, the amount owed on the car loan ($y$) decreases.