which graph could represent y, the amount owed on a car loan, as regular payments are made each month, x?
which graph could represent y, the amount owed on a car loan, as regular payments are made each month, x?
Answer
Explanation:
Step1: Analyze the relationship
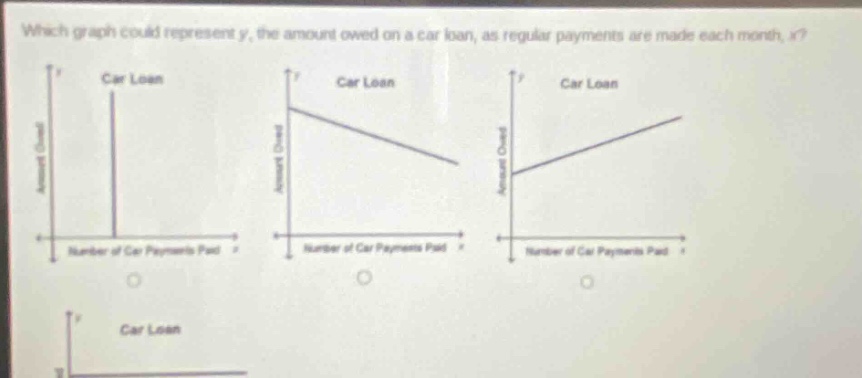
As regular payments are made each month ($x$ increases), the amount owed on a car - loan ($y$) decreases.
Step2: Evaluate the graphs
The first graph is a vertical line, which does not represent a decrease as $x$ changes. The third graph shows $y$ increasing as $x$ increases, which is incorrect for a loan - payment situation. The fourth graph shows $y$ remaining constant as $x$ changes, which is also incorrect. The second graph shows a linear decrease in $y$ as $x$ (number of car payments made) increases, which is consistent with the situation of paying off a car loan.
Answer:
The second graph.