below is a graph showing a companys annual profits. what do the lines connecting the points mean? profits…
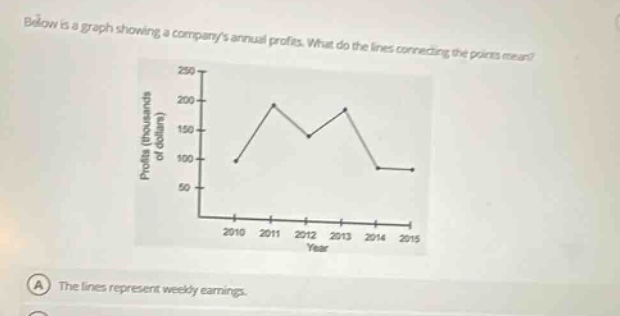
below is a graph showing a companys annual profits. what do the lines connecting the points mean? profits (thousands of dollars) 250 200 150 100 50 2010 2011 2012 2013 2014 2015 year a the lines represent weekly earnings.
Answer
Brief Explanations:
The graph shows annual profits. The lines connecting the points show the trend and change in the company's annual profits over the years. They illustrate how the profit value moves from one year - to the next, indicating growth, decline, or stability in annual profit amounts between consecutive years.
Answer:
The lines show the trend and change in the company's annual profits over the years.