the graph below shows the amount of money left in the schools desk fund, f, after d desks have been…
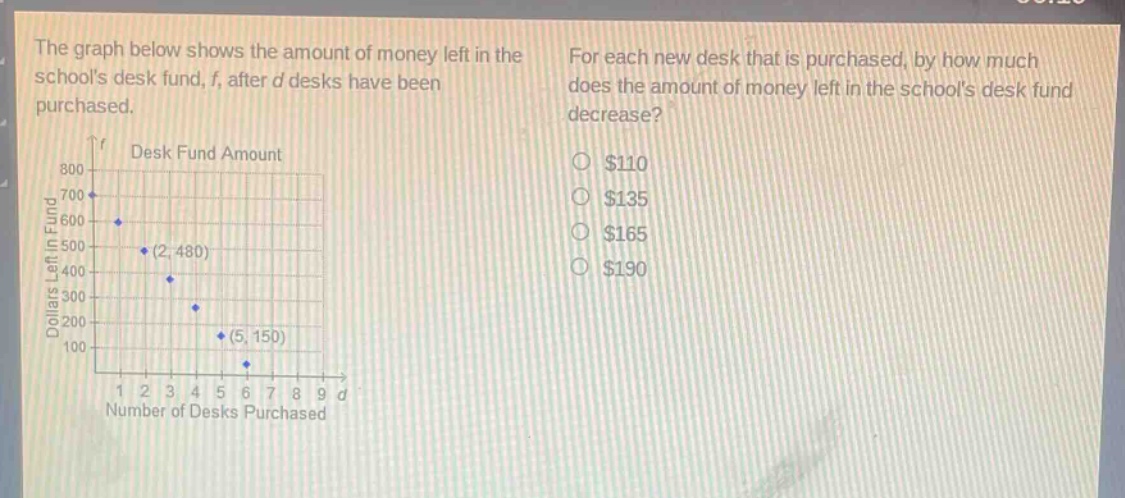
the graph below shows the amount of money left in the schools desk fund, f, after d desks have been purchased. for each new desk that is purchased, by how much does the amount of money left in the schools desk fund decrease? \ndesk fund amount\ndollars left in fund\nnumber of desks purchased\n$110\n$135\n$165\n$190
Answer
Explanation:
Step1: Find two points on the graph
We have points $(2,480)$ and $(5,150)$.
Step2: Calculate the change in money and desks
Change in money $\Delta f=480 - 150=330$, change in desks $\Delta d=5 - 2 = 3$.
Step3: Find the rate of change
The rate of change (decrease in money per desk) is $\frac{\Delta f}{\Delta d}=\frac{330}{3}=110$.
Answer:
$110$