the graph shows the balance of an account that is earning interest over time. in which year was the account…
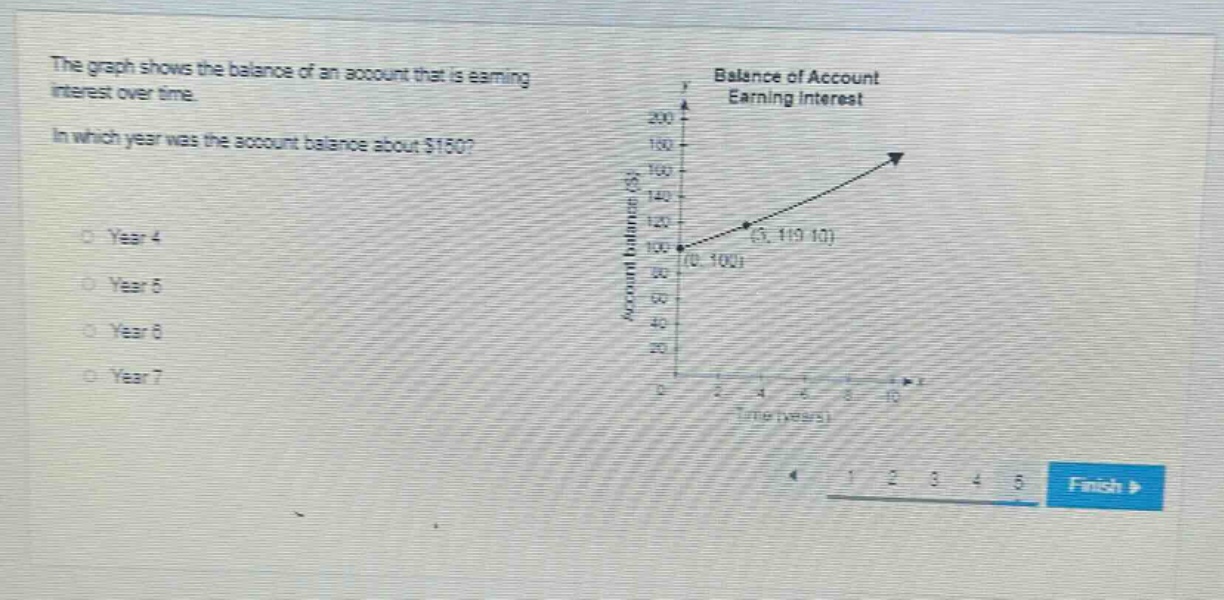
the graph shows the balance of an account that is earning interest over time. in which year was the account balance about $150? year 4 year 5 year 6 year 7
Answer
Explanation:
Step1: Locate $150 on y - axis
Find the value of 150 on the account - balance (y) axis.
Step2: Draw a horizontal line
Draw a horizontal line from the 150 - mark on the y - axis until it intersects the curve.
Step3: Drop a vertical line
From the intersection point on the curve, drop a vertical line to the time (x) axis.
Step4: Read the x - value
Read the value on the x - axis. It is approximately 7.
Answer:
Year 7