the graph shows the stock value for a technology company from 2002 to 2005. from this graph, what is the…
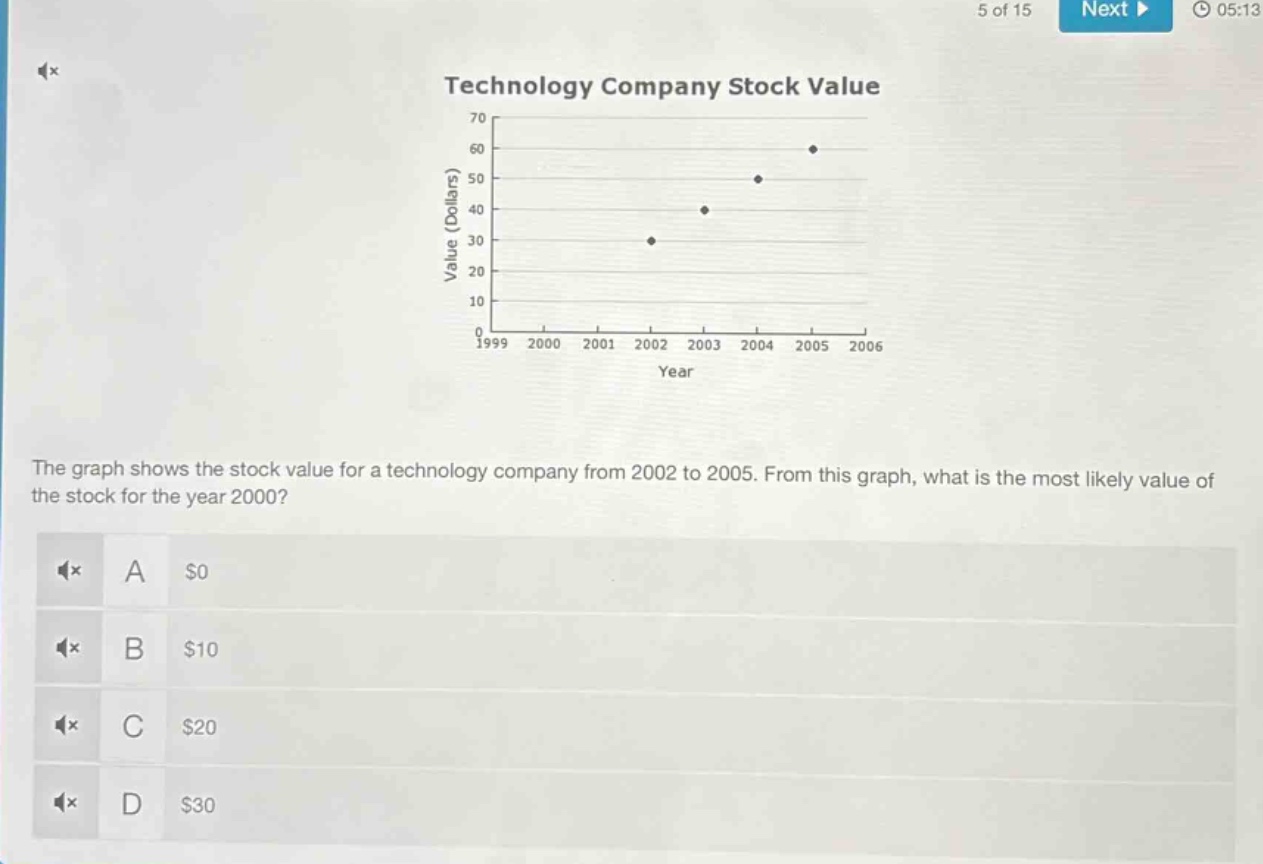
the graph shows the stock value for a technology company from 2002 to 2005. from this graph, what is the most likely value of the stock for the year 2000? a $0 b $10 c $20 d $30
Answer
Explanation:
Step1: Observe the trend
The stock - value is increasing from 2002 to 2005.
Step2: Extrapolate backwards
Assuming a relatively linear increase in stock - value over time, going back from 2002 (where value is $30) to 2000, we expect a lower value. Since the increase seems to be somewhat steady, and considering the time gap, a value of $10 is a reasonable estimate.
Answer:
B. $10